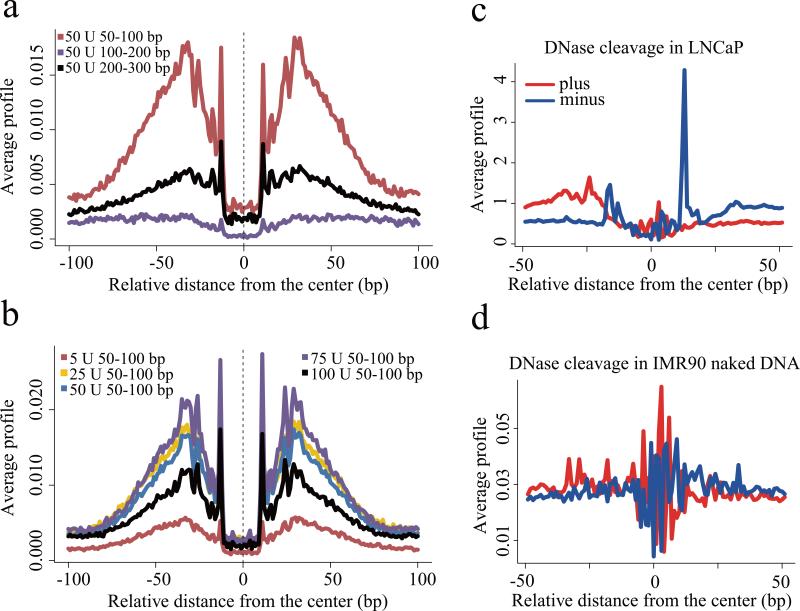
Figure 4. CTCF footprint.
(a) Nucleotide resolution DNase cleavage frequencies across CTCF recognition sequences at CTCF ChIP-seq peaks in LNCaP. DNase-seq signals were normalized to 1M reads in a non-strand specific manner. Short 50-100bp fragments produce clearer cleavage signals than 100-200bp or 200-300bp fragments. (b) DNaseI enzyme strength is most effective for detecting CTCF cleavage patterns in the 25U-75U range. (c) The positional distribution of oriented tags relative to the CTCF motif at CTCF ChIP-seq peaks in LNCaP reveals a strong directionality in the DNaseI cleavage pattern. Heatmaps show cleavage patterns at each locus for plus (red) and minus (blue) strands independently. The heatmap rows are ranked by the total DNase-seq tag count in each 100bp region. (d) The pattern of cleavage across the CTCF recognition sequence in naked DNA derived from the IMR90 cell line is very different from that observed in LNCaP chromatin at CTCF binding sites.

