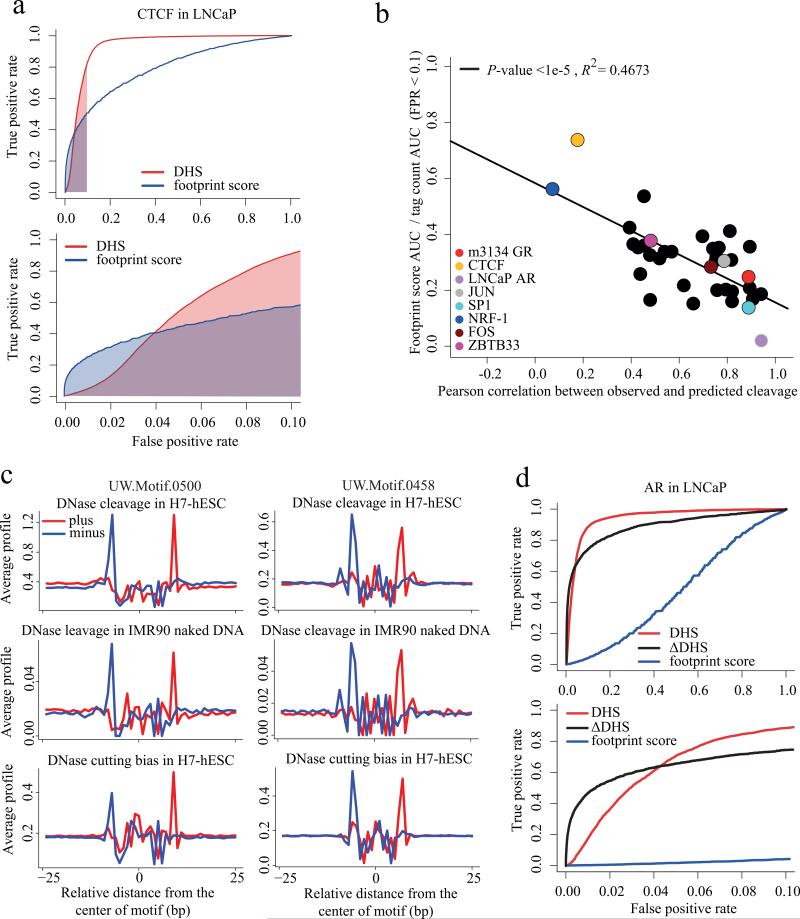
Figure 6. Predicting transcription factor binding from DHS.
(a) Receiver-operator curve comparing the performance of the DNase-seq footprint with the absolute DNase-seq tag count (DHS, red). From amongst all CTCF recognition sequences genome wide we predicted the ones that are CTCF ChIP-seq enriched using the DNase-seq footprint score (blue) and the number of DNase-seq tags in a 200bp window centered in the CTCF site (red). Only at low false positive rates (FPR) does the footprint score perform better than the tag count. The footprint score area under the curve (AUC) for FPRs less than 0.1 is shaded blue. Similarly the red shaded region is the AUC for the absolute tag count for FPR < 0.1. (b) For 36 transcription factors with known DNA binding motifs and ChIP-seq we constructed ROC curves like (a). The y-axis represents the footprint score relative to tag count performance as the ratio of the footprint score AUC to the tag count AUC for FPRs < 0.1. For CTCF this is the ratio of blue to red shaded areas in (a). The x-axis represents the Pearson correlation between the observed DNase cleavage pattern and that predicted from the hexamer intrinsic bias model. This shows how the footprint score performance deteriorates as the correlation between observed and predicted cleavage patterns increases. (c)
Comparison of observed, predicted and naked DNA cleavage bias in de novo motifs UW.Motif.0500 and UW.Motif.0458. (d) Receiver-operator curve for AR in LNCaP, comparing the performance of the DNase-seq footprint (blue) with the absolute tag count (DHS, red) and the ΔDHS score (black). While the footprint score is uninformative, the ΔDHS score, which compares DNase-seq between hormone stimulated and unstimulated conditions, performs better than the tag count at low FPRs.

