Figure 8.
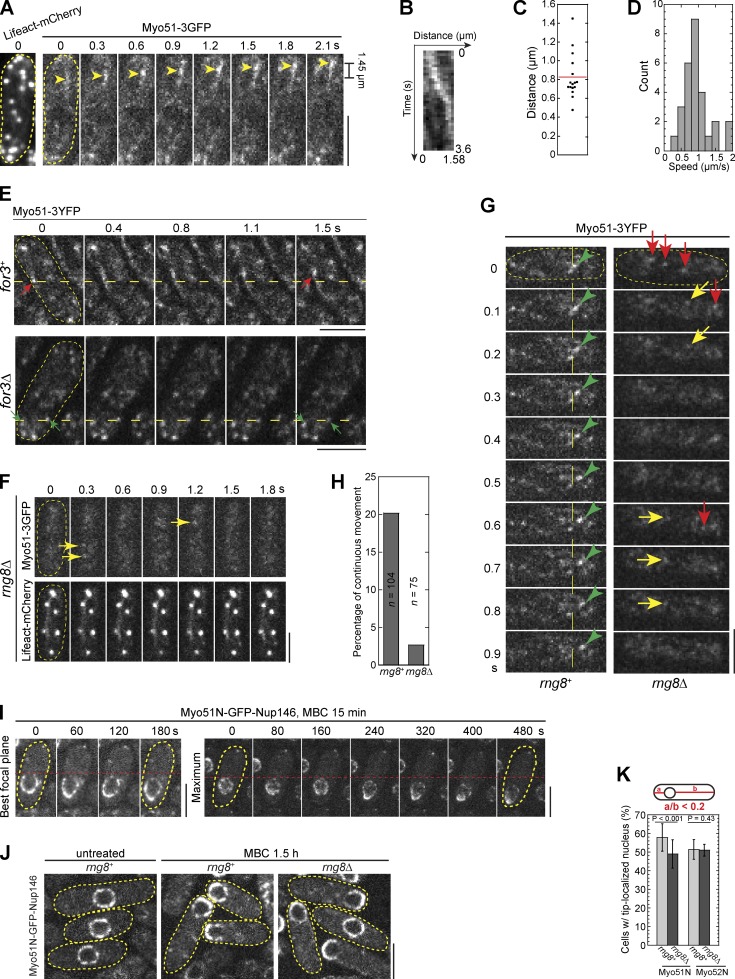
Rng8 is required for continuous movement of Myo51 puncta on actin tracks. (A–D) Movements of Myo51 puncta on actin tracks in wt cells. (A) Time course of the continuous movement of a punctum (arrowheads) in a cell expressing both Lifeact-mCherry (left) and Myo51-3GFP (right). See Video 6. Cell boundaries are indicated by broken lines. (B) Kymograph showing the movement of a punctum over 3.6 s. Images were collected with 0.1-s intervals. (C) Dot plot of travel distances of Myo51 puncta. This experiment was completed once (n = 16). (D) Distribution of Myo51 instantaneous speed (µm/s). n = 28 from five puncta. (E) Myo51 punctum movement depends on actin cables. Red arrows mark a punctum moving continuously and directionally in a for3+ cell, and the green arrows mark two puncta staying still in for3Δ. Images were collected with 0.2-s intervals. (F–H) Continuous movement of Myo51 puncta depends on Rng8. (F) Time course showing that Myo51-3GFP speckles (top) in a rng8Δ cell do not move continuously on actin tracks (bottom). Arrows mark speckles that are on actin tracks at one point and disappear at the next time point. (G) Time course showing the movement of Myo51-3YFP puncta (in rng8+; green arrowheads) or Myo51 speckles (in rng8Δ). Speckles in rng8Δ either diffuse out of plane (lost track, red arrows) or diffuse around but do not move continuously (yellow arrows). See Video 7. (H) Percentage of Myo51 puncta or speckles with continuous movement, which is defined as movements that are traceable and showing unidirectional movement for ≥0.3 s in an 8-s movie with 0.1-s intervals. (I) Time courses of the nuclear displacement toward the cell tip in two cells expressing Myo51N-GFP-Nup146 after MBC treatment (Video 8). The left cell shows the best focal plane and the right shows one maximum projection. Cells were grown in EMM5S for ∼24 h and then treated with MBC for 15 min. The broken lines in E, G, and I are reference lines to aid comparisons of movements. (J) Nuclear displacement by Myo51N-GFP-Nup146 in rng8+ or rng8Δ cells 1.5 h after MBC treatment. (K) Quantification of cells with tip-localized nuclei in cells expressing Myo51N-GFP-Nup146 or Myo52N-GFP-Nup146. Definition of tip localization is shown on the top. More than 150 cells in each experiment (n ≥ 3) for each strain. Error bars indicate 1 SD. Bars, 5 µm.

