
FIG 2.
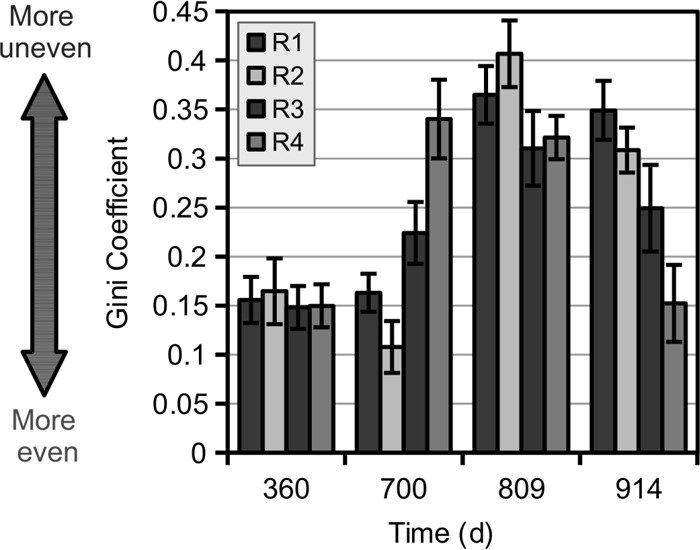
Evenness (measured as the Gini coefficient) of 97% ID (species-level) bacterial OTU profiles, determined based on near-full-length 16S rRNA gene sequencing characterizations of bioreactor samples. Microbiomes became more uneven following high-ammonia stress (R3 and R4) (day 700) and increased temperature (all bioreactors increased from 25°C to 35°C prior to day 809). As the bioreactor performance of R3 and R4 recovered by day 914, bioreactors returned to a more even community composition. As noted on the y axis, greater evenness is signified by a lower Gini coefficient. Error bars represent the SD of 100 rarefactions of 100 sequences each.