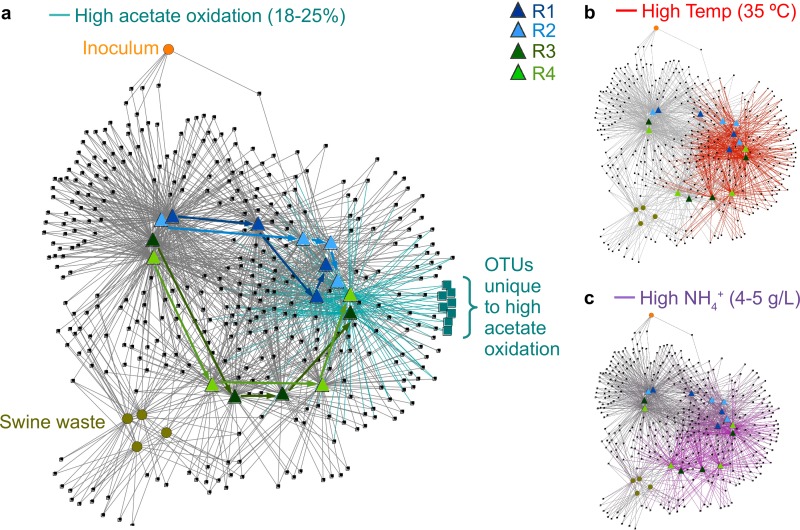
FIG 3.
Bipartite network of samples and OTUs clustered from bacterial 16S rRNA gene sequencing characterizations of bioreactor samples for days 360, 700, 809, and 914 and for bioreactor inoculum and four swine waste feed batches. Edges are colored by increased acetate oxidation (a), increased temperature (from 25°C to 35°C) (b), and high ammonia concentrations (R3 and R4 on days 700, 809, and 914) (c). Squares represent OTUs, circles represent samples of bioreactor inputs (granular inoculum from upflow digesters treating brewery wastewater and swine waste feed), and triangles represent bioreactor samples. Edges were drawn between each OTU and the samples in which it was detected; only OTUs appearing in more than one sample are shown. Blue and green arrows in panel a indicate the time series sequence for each bioreactor, beginning with day 360 in the top left bioreactor sample cluster.

