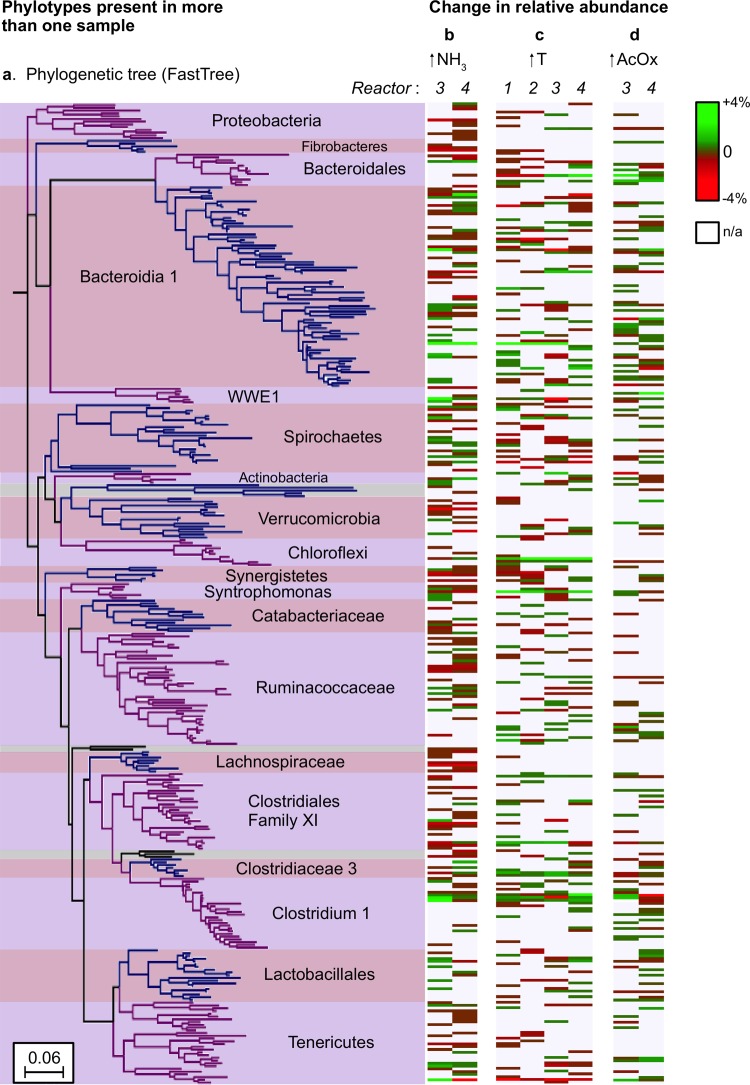
FIG 4.
Phylogenetic tree of OTUs that appear in more than one sample from bacterial 16S rRNA gene sequencing characterizations for bioreactor days 360, 700, 809, and 914 (a), along with heat maps indicating the extent to which the relative abundance of each OTU changed concurrently with a change under conditions of an increase in ammonia concentrations in R3 and R4 between days 360 and 700 (b), an increase in temperature between days 700 and 809 (c), and an increase in syntrophic acetate oxidation (AcOx) in R3 and R4 between days 809 and 914 (d). The scale on the color key is relative to the total community (e.g., an OTU that increased in relative abundance from 3% to 7% would be displayed here as +4%). OTUs that appeared in more than one sample included all OTUs with >2% relative abundance in any bioreactor sample. n/a, not applicable.

