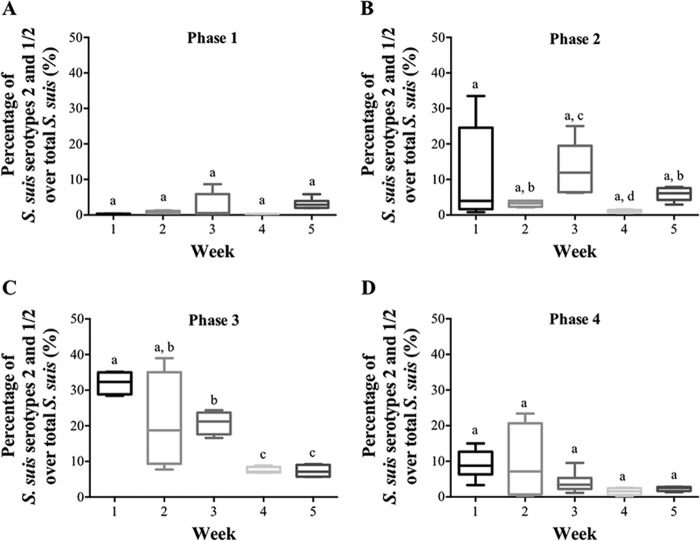
FIG 4.
Quantification of airborne bacteria during five consecutive weeks by PCR in one SCB (SCB1), combining different rooms for each age group. (A) Analysis of three swine maternity rooms (corresponding to phase 1). (B) Analysis of three nursery swine rooms (phase 2). (C) Analysis of two nursery swine rooms (phase 3). (D) Analysis of three swine fattening rooms (related to phase 4). The top of the box plot represents the 75th quartile, and the bottom represents the 25th quartile; the median is the horizontal line, and the lower and upper whiskers represent the minimum and maximum values, respectively. The letters a, b, c, and d represent statistical differences in the presence of S. suis serotype 2/total S. suis in the air as a function of time and depending on swine growth steps. P < 0.05.

