
FIG 7.
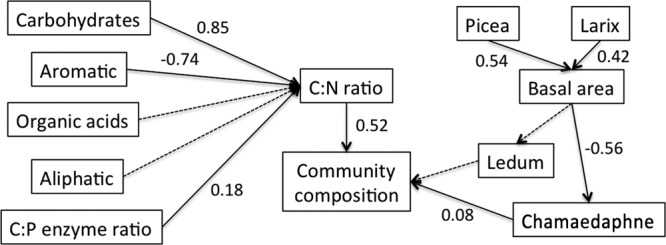
Path analysis to analyze direct and indirect effects of organic matter composition, nutrient availability, and vegetation cover on microbial community structure. Chi-square test, 25.89; P = 0.13. Solid and dashed arrows indicate significant (P < 0.05) and nonsignificant (P > 0.05) causal relations, respectively. Numbers adjacent to each arrow indicate standardized path coefficients. Values in parentheses are fractions of the variance explained by the respective variable in the model.