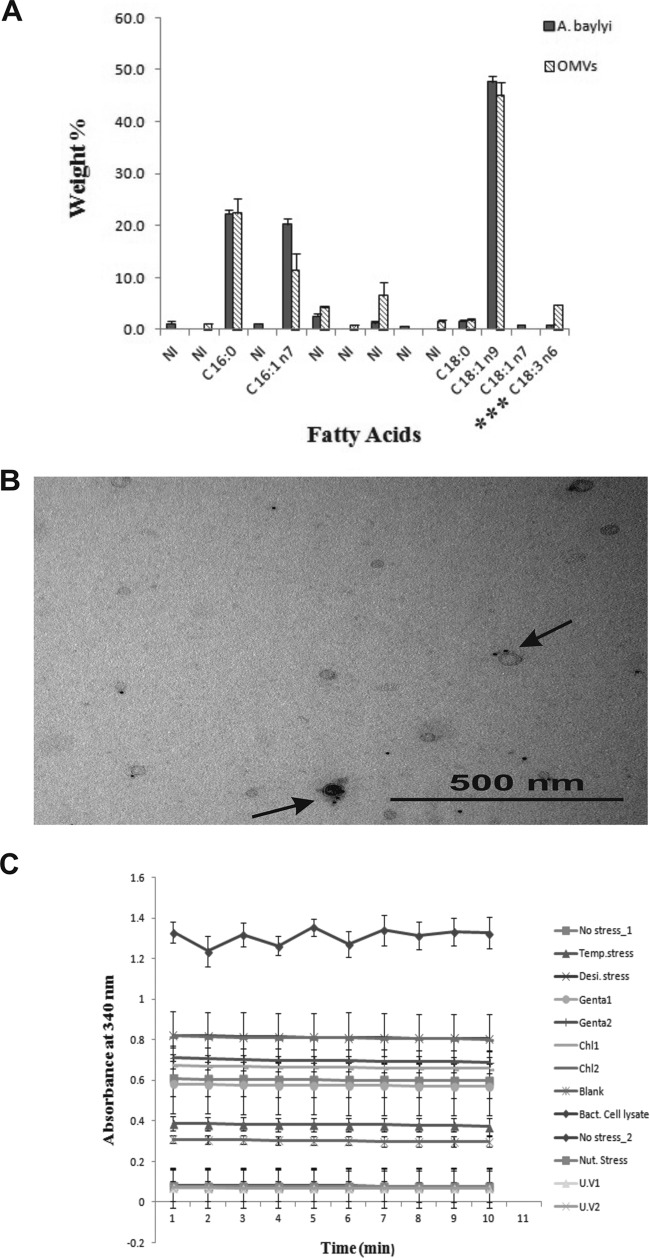
FIG 2.
Analysis of the membrane compositions of OMVs from A. baylyi JV26. (A) Histogram based on the mean values of cellular and vesicular fatty acids of A. baylyi. The fatty acid with three asterisks indicates that the values for this fatty acid were significantly different between cells and vesicles. Error bars indicate standard deviations. NI, not identified. (B) IEM image of unsectioned OMVs stained with uranyl acetate. Arrows indicate gold particles (black dots, 5 nm) attached to rabbit anti-OmpA antibodies. Bar, 500 nm. (C) Quantification of inner membrane-associated β-NADH oxidase activity. Bacterial cell lysate is the positive control. No activity was detected for OMVs released from A. baylyi (JV26) with no stress (No stress_1), temperature stress, desiccation stress, 0.1 μg ml−1 of gentamicin (Genta1), 0.3 μg ml−1 of gentamicin (Genta2), 0.1 μg ml−1 chloramphenicol (Chl1), 1 μg ml−1 chloramphenicol (Chl2), bacterial cell lysate grown with no stress in M9 minimal medium (No stress_2), nutrient stress, UV light exposure for 5 min (U.V1), UV light exposure for 20 min (U.V2), and a negative control (Blank). Error bars indicate standard deviations.

