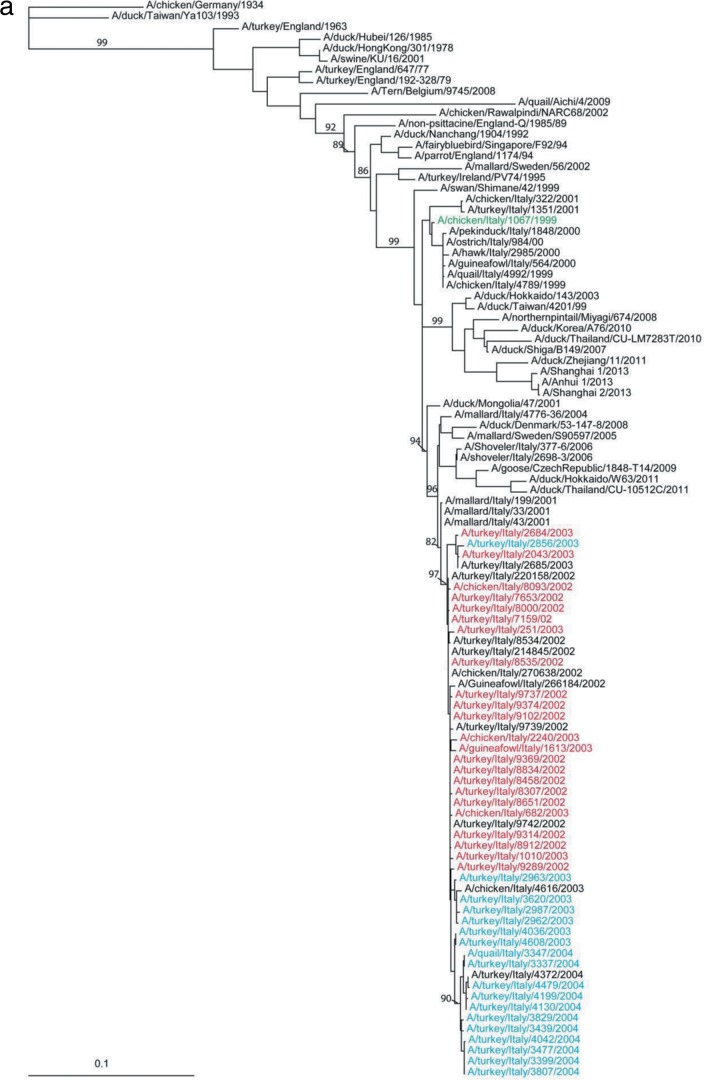
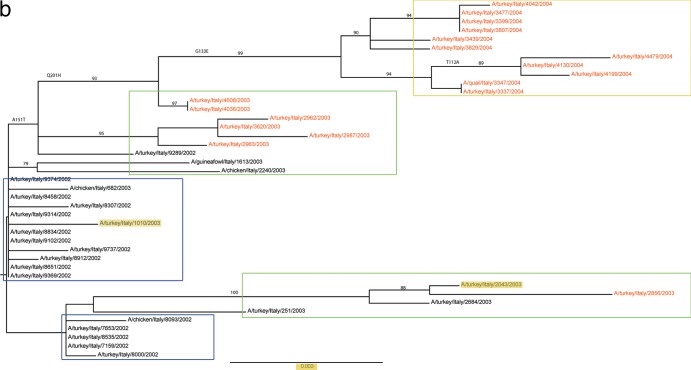
FIG 1.
(a) Phylogenetic analysis of HA gene segments of H7N3 influenza A viruses from 2002-2004 outbreak in Italy and of H7 viruses isolated elsewhere. The isolates from unvaccinated farms are marked in red and those from vaccinated farms in blue. The phylogenetic analyses were performed using maximum likelihood by GARLI (25) and bootstrap resampling analyses using PAUP* 4.0 Beta (26) to apply a neighborhood joining method, as described earlier (28). (b) Phylogenetic analysis of HA gene segments of H7N3 influenza A viruses from 2002-2004 outbreak in Italy. The isolates from unvaccinated farms are marked in black and those from vaccinated farms in red. Colored boxes are used to highlight the year of isolation: blue for viruses from 2002, green for viruses from 2003, and yellow for viruses from 2004.


