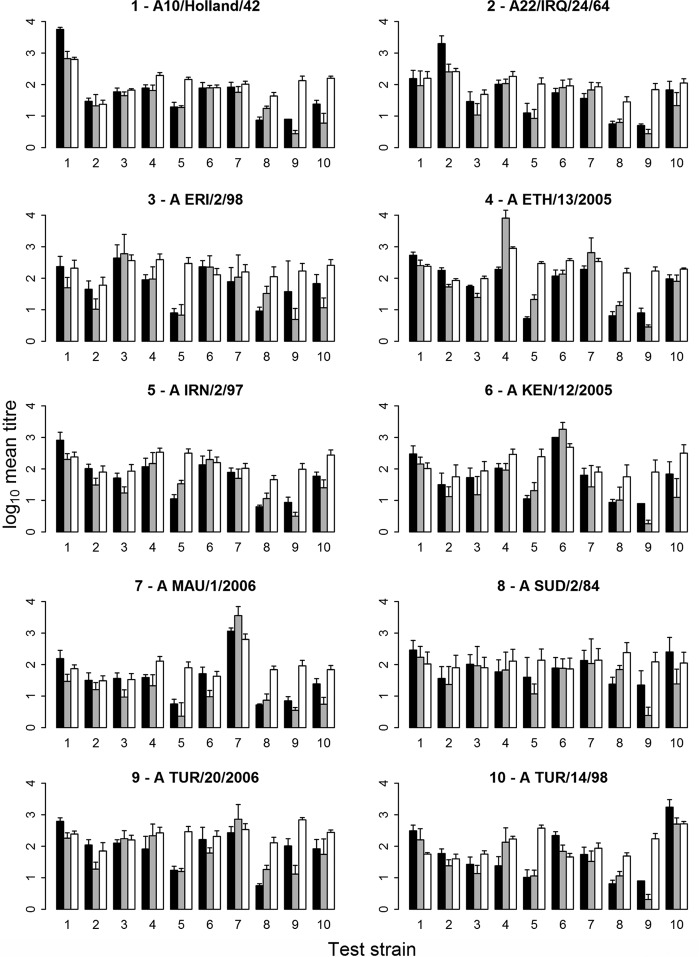
FIG 2.
Mean titers and the standard error of the mean (SEM) values of the three serological methods, i.e., VNT (black), NIT (gray), and LPB-ELISA (white) for each vaccine and tested against the corresponding test strain (same number means the same strain). The individual graphs show the log10 mean titers and the standard error of the mean of the sera of each group of vaccinated cattle (5 cattle) tested against the 10 different FMDV type A test strains (x axis). The homologous responses are those for which the number of the test strain (x axis) is equal to the number in the title of a particular panel.

