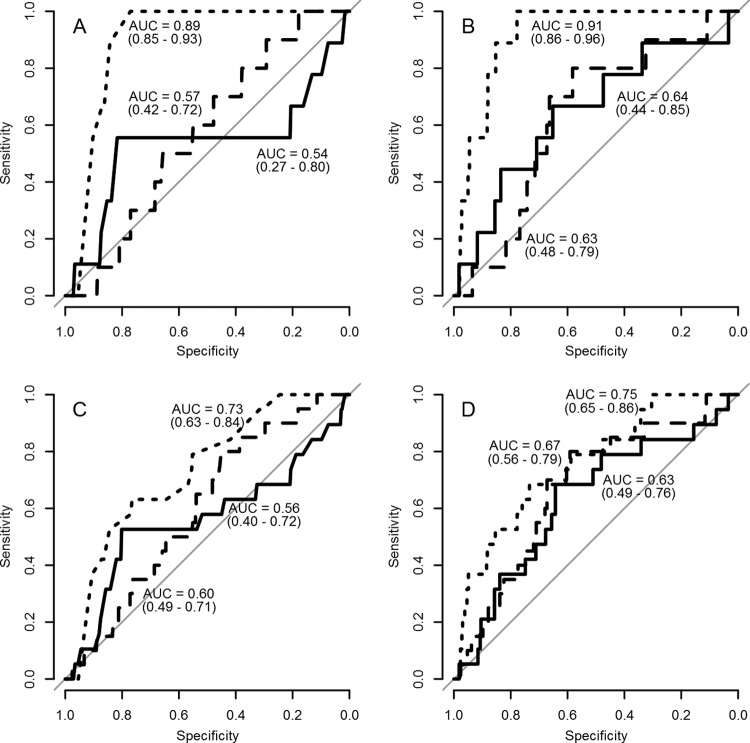
FIG 4.
ROC curves of the r1-value titers of the VNT (solid line), NIT (dashed line), and LPB-ELISA (dotted line). In the graphs, the area under the curve (AUC) is given, with the 95% confidence interval in parentheses. (A and B) Strains A/IRN/2/97 and A/TUR/14/98 are assumed to be antigenically the same, using the observed titers (A) and scaled titers (B). (C and D) Strains A/IRN/2/97 and A/TUR/14/98 as well as A/ERI/2/98 and A/SUD/2/84 are assumed to be antigenically the same, using the observed titers (C) and scaled titers (D).

