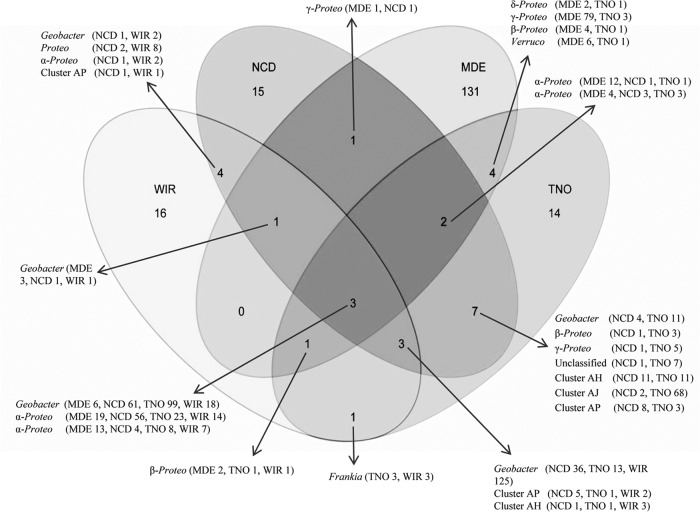
FIG 3.
Venn diagram displaying the distribution of nifH OTU95s across the four field sites (WIR, NCD, TNO, and MDE). Numbers within the diagram show the number of OTU95s shared between sites or unique to a given site. Arrows point to the taxonomic identity of the OTU95s, and the accompanying values in parenthesis indicate the number of sequences from each site comprising each OTU95.

