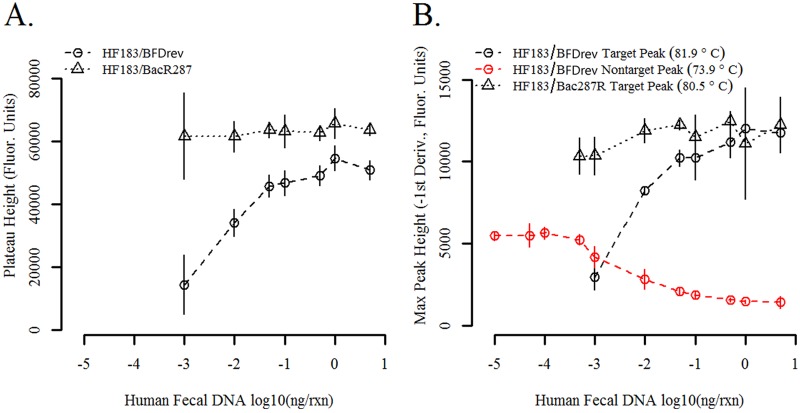
FIG 3.
Reduction of amplification performance at low DNA template concentrations due to the formation of spurious PD products in HF183/BFDrev products but not in HF183/BacR287 products. (A) Reduction of the amplification plateau height for the HF183/BFDrev TaqMan assay but not for the HF183/BacR287 TaqMan assay as the concentration of DNA template decreases. (B) SYBR green maximum peak heights at different human fecal DNA composite template concentrations indicating the formation of low-melting-temperature products at low template concentrations with HF183/BFDrev but not HF183/BacR287. Error bars represent 2 standard deviations from the mean (n = 4). Amplification curves that did not fit a 7-parameter sigmoidal model with an R2 value of ≥0.999, which was typically the result of no or poor amplification, were omitted from the analysis. rxn, reaction mixture; −1st Deriv., negative first derivative.

