
FIG 1.
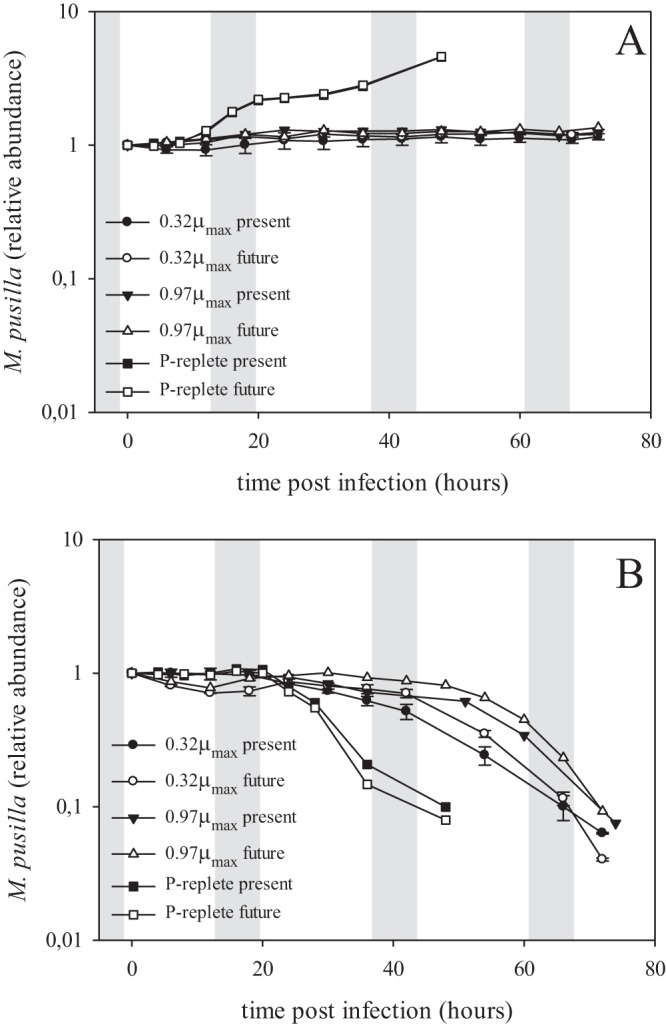
Algal temporal dynamics of the viral infection experiment. Micromonas pusilla in noninfected cultures (A) and in virally infected cultures (B). Filled symbols represent present-day (370 μatm) pCO2, and open symbols represent future (750 μatm) pCO2. Circles represent 0.32-μmax P-limited cultures, triangles 0.97-μmax P-limited cultures, and squares P-replete cultures. Abundances are normalized to the start of the experiment (T0). Gray bars represent the dark period (night). Note that the noninfected P-replete present and future pCO2 treatments (A) fall on top of each other. Note the log scale on the y axis. The 0.32-μmax cultures are averages from duplicate cultures.