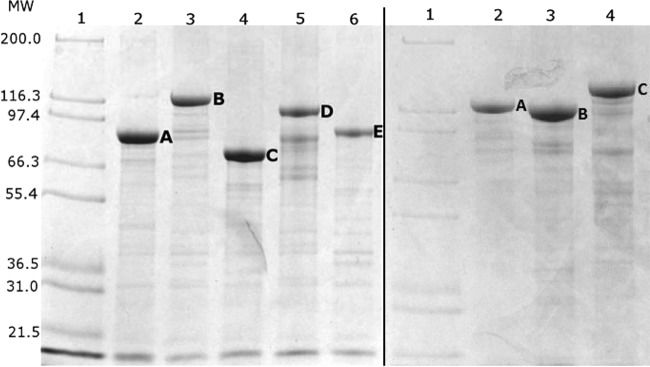
FIG 2.

Protein profiles of isolated GFP particles as shown by SDS-PAGE analysis. (Left) Lane 1, Mark 12 Unstained Standard Protein Ladder (Invitrogen, USA); lane 2, GNLN (A); lane 3, GiCLN (B); lane 4, GNLZ (C); lane 5, GiCLZ (D); lane 6, NanA-PhaC (E). (Right) Lane 1, Mark 12 Unstained Standard Protein Ladder (Invitrogen, USA); lane 2, GiCLO (A); lane 3, GiCLN (B); lane 4, GiCLB (C) The letters A, B, C, D, and E correspond to the fusion proteins of interest overproduced in their respective lanes. G, GFP; iC, inactive PhaC; L, linker; N, NanA; Z, ZZ; B, BLA; O, OpdA. MW, molecular weights in thousands.
