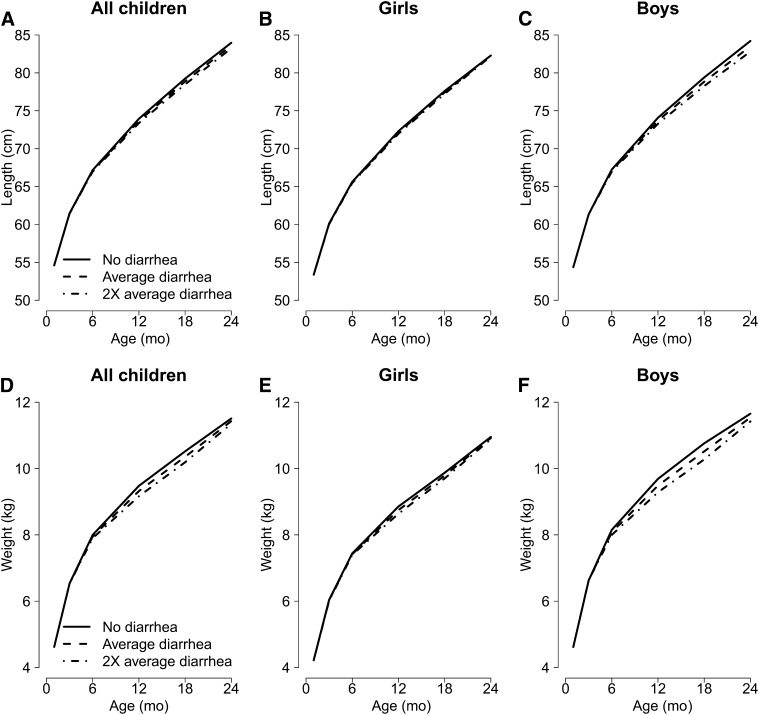
FIGURE 5.
Growth trajectories (length in A–C, weight in D–F) of children with different burdens of diarrhea [no diarrhea, the mean burden of diarrhea (5%, 7%, 8%, 7%, and 5% of days with diarrhea in the age groups 0–3, >3–6, >6–12, >12–18, and >18–24 mo, respectively), and twice the mean burden of diarrhea during the first 2 y of life], overall and by sex, from a combined dataset including data from 7 cohort studies.

