FIG 3.
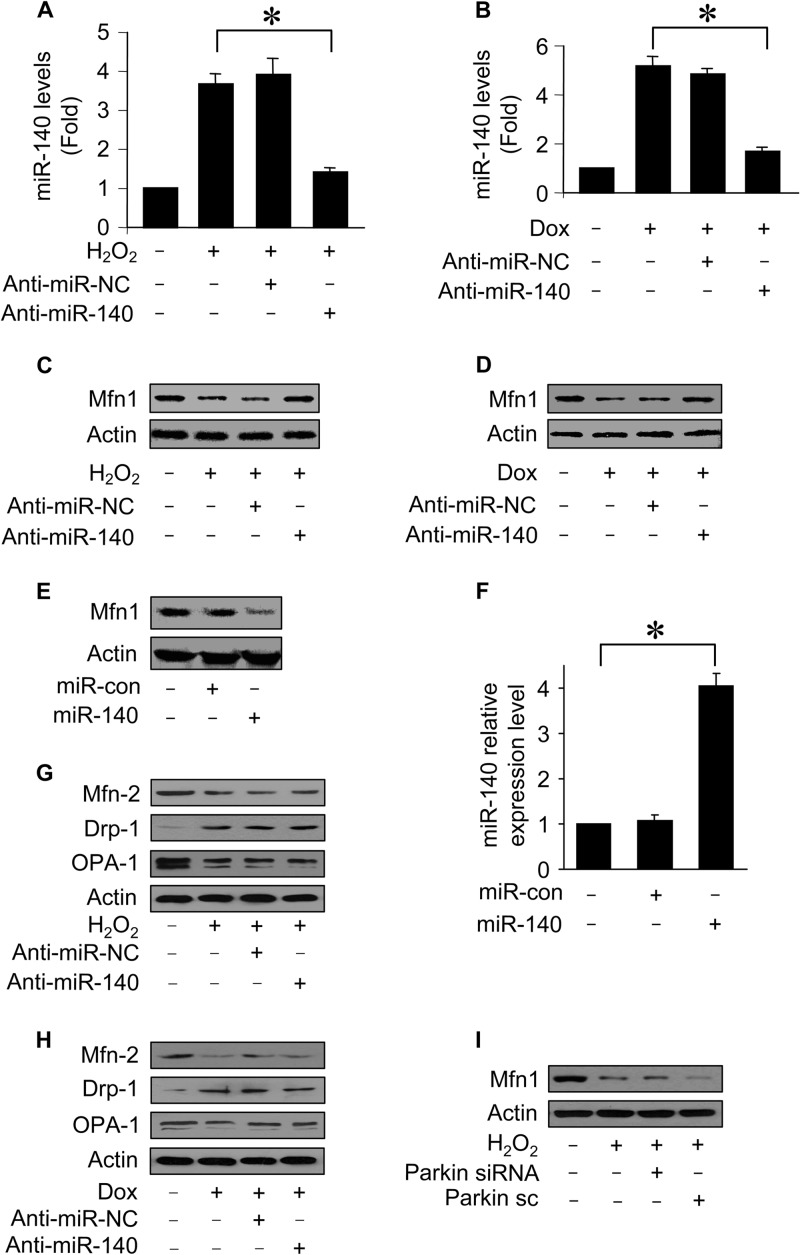
miR-140 suppresses Mfn1 expression. (A and B) miR-140 levels from cardiomyocytes transfected with miR-140 anti-miR or the anti-miR control (anti-miR-NC) and then exposed to H2O2 (A) or doxorubicin (B). *, P < 0.05. (C and D) Immunoblots of Mfn1 proteins from cardiomyocytes treated as described above for panels A and B. (E and F) Immunoblots of Mfn1 proteins and miR-140 levels from cardiomyocytes infected with adenoviral miR-140 or the control (miR-con). *, P < 0.05. Data represent three separate experiments. (G and H) Immunoblots of Mfn2, Drp1, and OPA1 proteins from cardiomyocytes treated as described above for panels A and B. Results are representative of three independent experiments. (I) Immunoblot analysis of Mfn1. Cardiomyocytes were infected with adenoviral small interfering RNA (siRNA) constructs targeting parkin or its scrambled form (sc) and then exposed to H2O2. Data are expressed as means ± standard errors of the means of three independent experiments.

