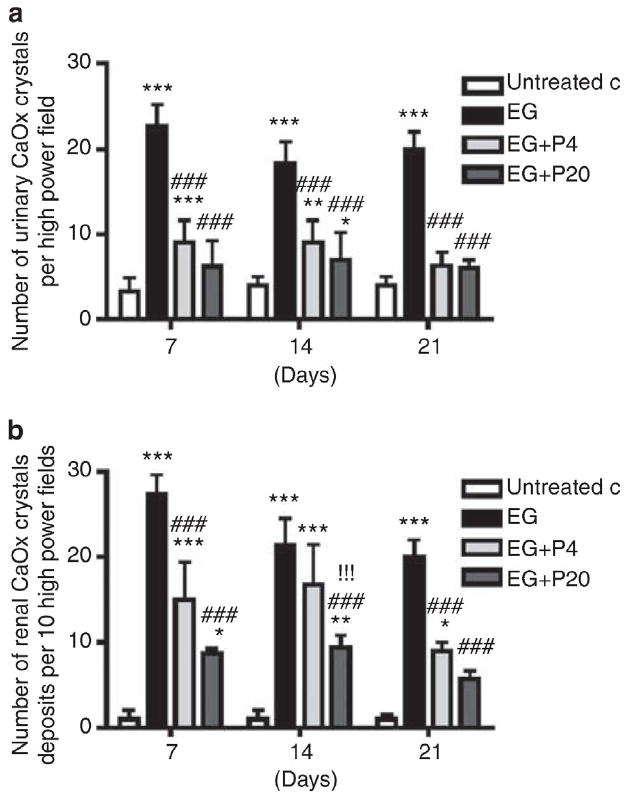
Figure 1. Effect of 1,2,3,4,6-penta-O-galloyl-b-D-glucose (PGG) on calcium oxalate (CaOx) crystal deposition in ethylene glycol (EG)-treated rat urine and kidneys.

(a) Twenty-four hour rat urine samples on days 7, 14, and 21 were collected on ice in a metabolic cage and CaOx crystals with tetragonal bipyramidal habit were counted in a hemocytometer at X400 magnification. Graph represents the average number of urinary CaOx crystals in the rat urine per high power field. (b) Histological specimens of rat kidney tissues (n=6/group) obtained on days 7, 14, and 21 following EG treatment were stained with hematoxylin and eosin (H&E), and the number of crystal depositions was counted. Graph represents the average number of crystal deposits in the kidney per high power field. Data represent means±s.d. *P<0.05, **P<0.01, and ***P<0.001 versus untreated control; ###P<0.001 versus EG; and !!!P<0.001 versus EG+P4 two-way analysis of variance followed by a post hoc analysis. C, untreated control (distilled water); EG, EG-treated group (0.8% EG/1% ammonium chloride (AC) (NH4Cl) in drinking water); and EG+P4 and EG=P20, two EG- and PGG-treated groups (0.8% EG/1% AC + 4 or 20 mg/kg of PGG in 2% methylcellulose).
