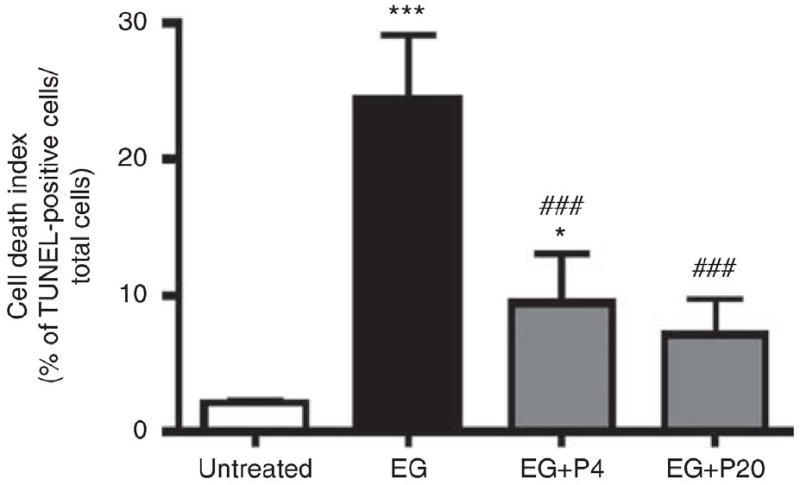
Figure 5. Effect of PGG on cell death index TUNEL staining in EG treated rat kidneys.

Cell death was assessed by TUNEL assay in rat kidney tissues (n¼6/group) obtained on day 21 following EG treatment. Graph represents the average number of TUNEL positive stained cells per high power field. Data represent means±s.d. ###P<0.001 versus untreated control, and *P<0.05 and ***P<0.001 versus untreated control, ###P<0.001 versus EG, two-way analysis of variance followed by a post hoc analysis. C, untreated control (distilled water); EG, EG treated group (0.8% EG/1% AC (NH4Cl) in drinking water) and, EG+P4 and EG+P20; two PGG-treated groups (0.8% EG/1% AC+4 or 20mg/kg of PGG in 2% methylcellulose).
