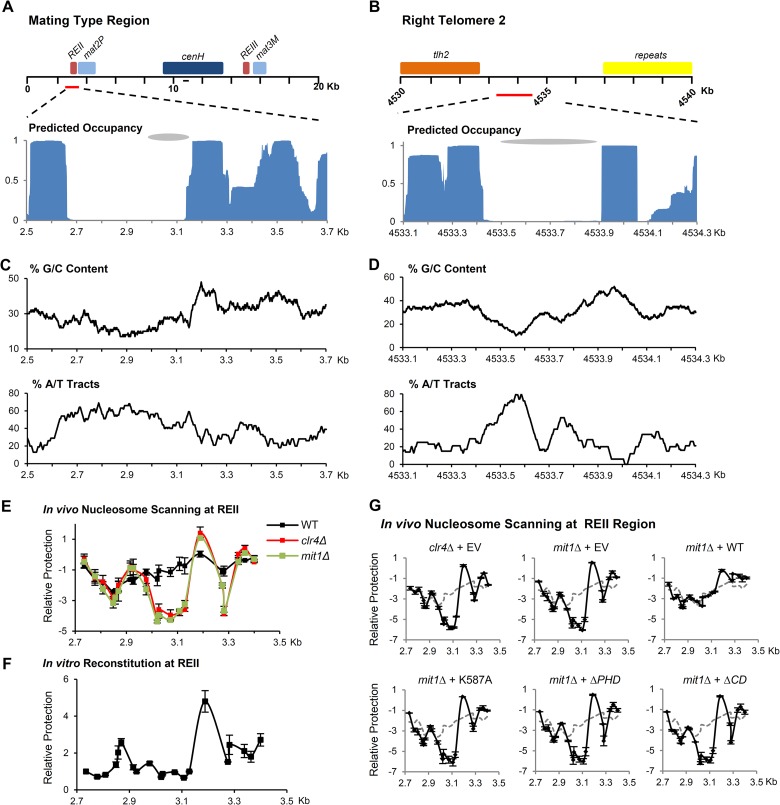
FIG 5.
Mit1 prevents the formation of an NFR on an intrinsically unfavorable site at REII. (A and B) Schematic of the fission yeast mating-type region and right telomere of chromosome 2. Predicted nucleosome occupancy using the Nucleosome Positioning Prediction Engine (NuPoP) for these regions is plotted below. Gray ovals indicate previously identified regions of nucleosome occupancy changes in mit1Δ cells. The line on the schematic represents the location of primers used for analysis in Fig. 1. (C and D) Sequence analysis of nucleosome-depleted regions. Sequence was analyzed for G/C content and the presence of A/T tracts and reported as the percentage of nucleotides in 100-bp windows that are either G or C or within A/T tracts defined as five or more consecutive A or T nucleotides. (E) In vivo nucleosome scanning of REII at the mating-type locus. A nucleosome scanning experiment compared the relative protection of the region surrounding the REII silencing element from digestion by micrococcal nuclease in wild-type, mit1Δ, and clr4Δ backgrounds. Mononucleosomal DNA was analyzed by Q-PCR, normalized to amplification within adh1+, and compared to that of the wild type. Data are plotted on a log2 scale; error bars represent SEM (n = 2). (F) In vitro nucleosome scanning at REII using reconstituted chromatin. A nucleosome scanning experiment used mononucleosomal DNA isolated from in vitro reconstitution of histones onto REII region synthetic DNA. Error bars represent SEM (n = 3). (G) Mutant Mit1 proteins cannot suppress NFR formation at REII in mit1Δ cells. A nucleosome scanning experiment was performed as for panel E, comparing wild-type cells transformed with empty vector (dashed line) to clr4Δ or mit1Δ cells transformed with empty vector and mit1Δ cells transformed with vectors expressing Mit1, Mit1K587A, Mit1ΔPHD, and Mit1ΔCD. Data are plotted on a log2 scale; error bars represent SEM (n = 2).

