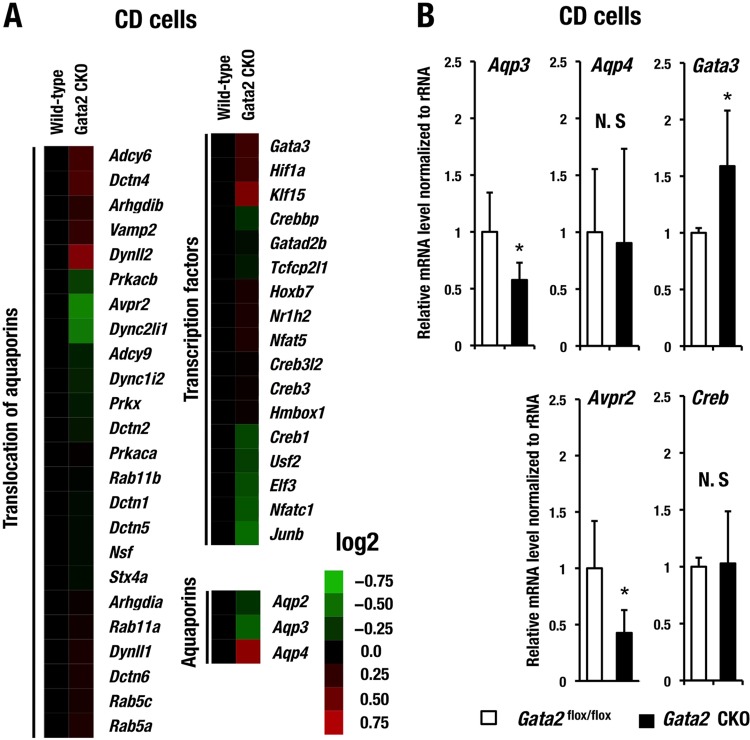
FIG 6.
Gene expression profile in CD cells. (A) Heat map generated from DNA microarray data of water reabsorption-related genes changed in CD cells of Gata2 CKO mice. Heat map colors indicate normalized expression level (log2). Genes are categorized into three groups by their function using Ingenuity pathway analysis (IPA) software and the Kyoto Encyclopedia of Genes and Genomes (KEGG) pathway database (http://www.genome.jp/kegg/pathway.html). (B) mRNA expression of Aqp3, Aqp4, Gata3, Creb, and Avpr2 in the CD cells of Gata2flox/flox and Gata2-CKO mice examined by qRT-PCR analysis. The statistical significance of the difference between the Gata2flox/flox and Gata2 CKO mice is indicated (*, P < 0.05; Student's unpaired t test, N.S; not significant).

