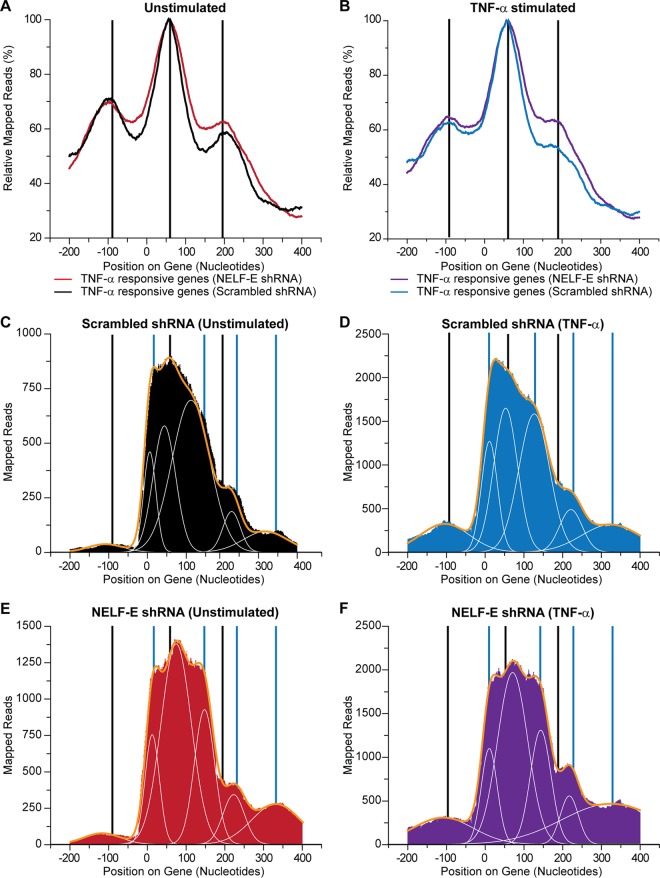
FIG 7.
Promoter-proximal pause sites on the HIV LTR. (A) The average RNAP II distribution relative to the transcription start site for the 500 genes that are most highly activated by TNF-α in unstimulated control (N1D9) cells (A) and control cells stimulated by TNF-α (B). (C to F) RNAP II accumulation in HIV promoter region in unstimulated control (N1D9) cells (C), control (N1D9) cells stimulated by TNF-α (D), unstimulated cells expressing NELF-E shRNA (N1C6) (E), and cells expressing NELF-E shRNA and stimulated by TNF-α (F). Black vertical lines indicate the sites of RNAP II accumulation on averaged cellular genes. Blue vertical lines indicate additional sites of RNAP II accumulation on the HIV LTR. The major peaks were fitted to a series of Gaussian curves (white lines) and summed (yellow lines).

