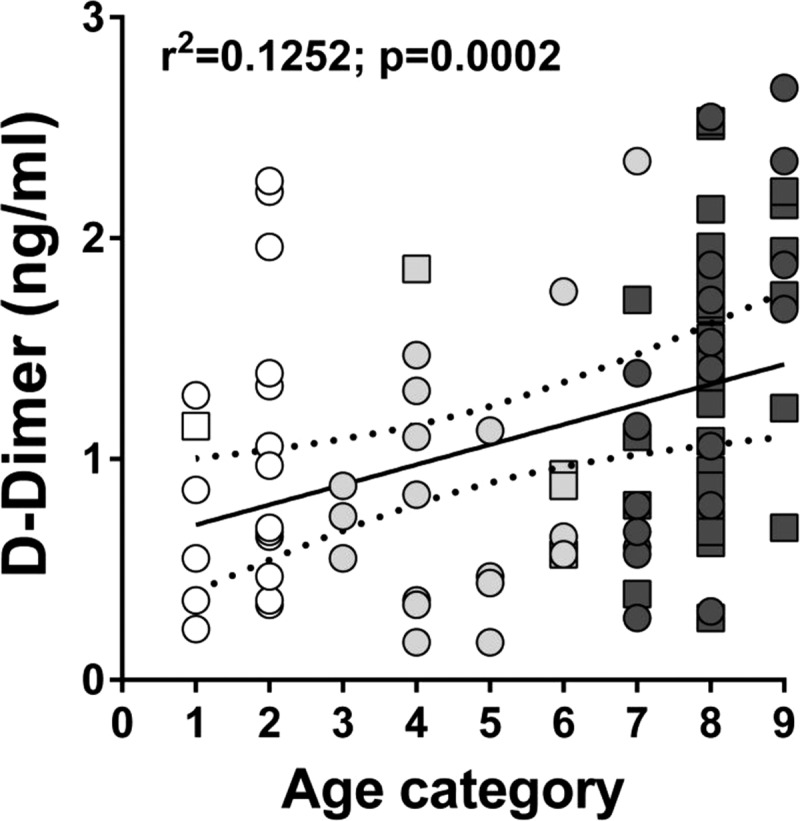
FIG 10.

Age-related rather than SIV status-related increase in D dimer levels in wild AGMs from the Gambia. The linear regression line and 95% confidence intervals (dotted lines) are shown. The x axis represents the age category (established by dentition) of the animals; the y axis represents the levels of D dimer/ml of plasma. Infant AGMs are shown as open circles and squares; juvenile AGMs are illustrated as light gray circles and squares; adult AGMs are shown as dark gray circles and squares. Uninfected monkeys are illustrated as circles; infected monkeys are illustrated as squares.
