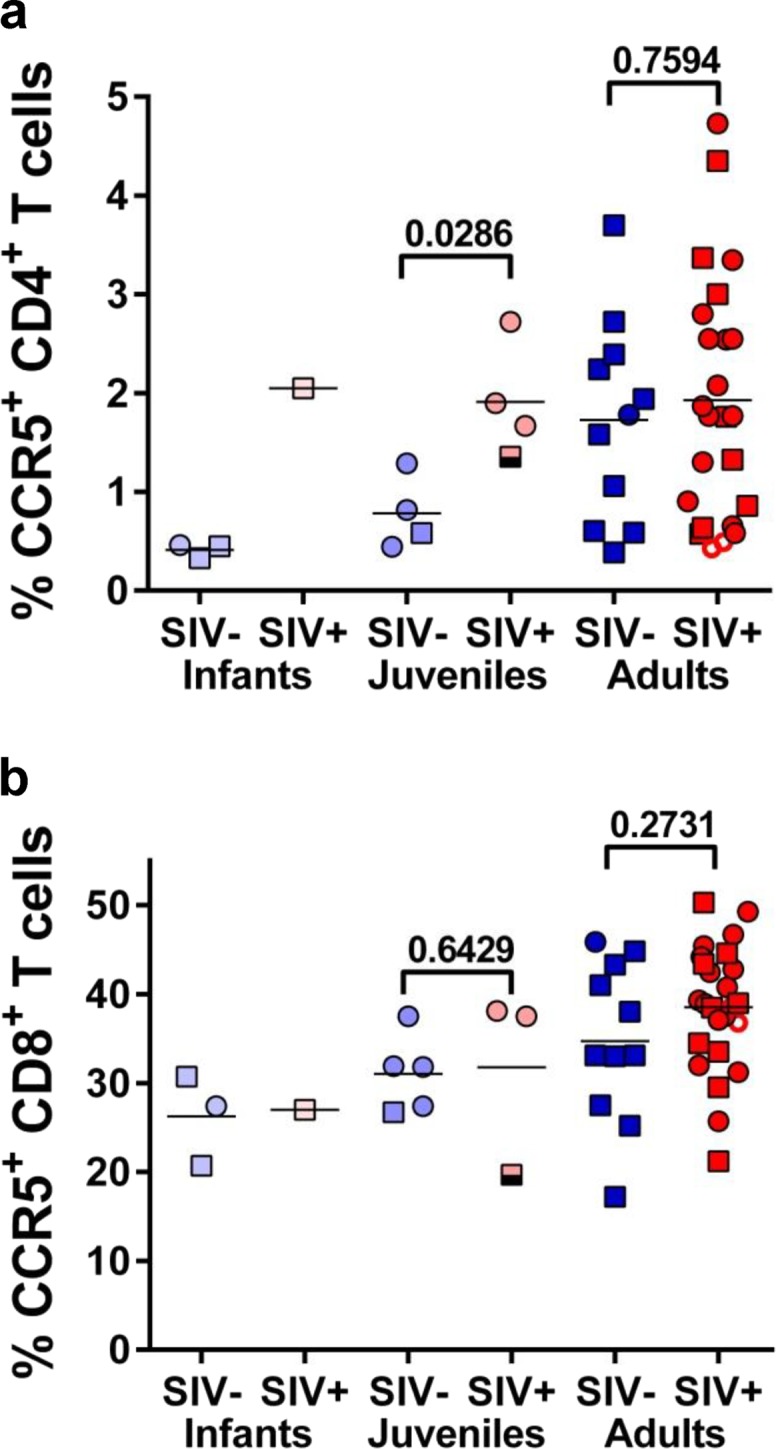
FIG 8.

Cross-sectional assessment of the levels of T cells expressing the CCR5 coreceptor in wild sabaeus monkeys from The Gambia. CCR5 expression was assessed on both CD4+ T cells (a) and CD8+ T cells (b). Infant AGMs are illustrated as open circles and squares; juvenile AGMs are illustrated as light colored circles and squares; adult AGMs are shown as dark colored circles and squares. Samples collected from female AGMs are illustrated as circles (○); samples collected from male AGMs are shown as squares (□); samples from uninfected AGMs are illustrated in different tones of blue; samples collected from SIVsab-infected AGMs are illustrated in different tones of red; samples from acutely infected adult females (defined as having high viral loads and negative serologies) are illustrated as open circles with enhanced margins; a sample from a juvenile AGM male with high viral loads but seropositive (probably postacutely infected) is shown as a half-empty square. P values were calculated by the Mann-Whitney U test. The values on the y axes depict the fraction of CCR5-expressing CD4+ or CD8+ T cells.
