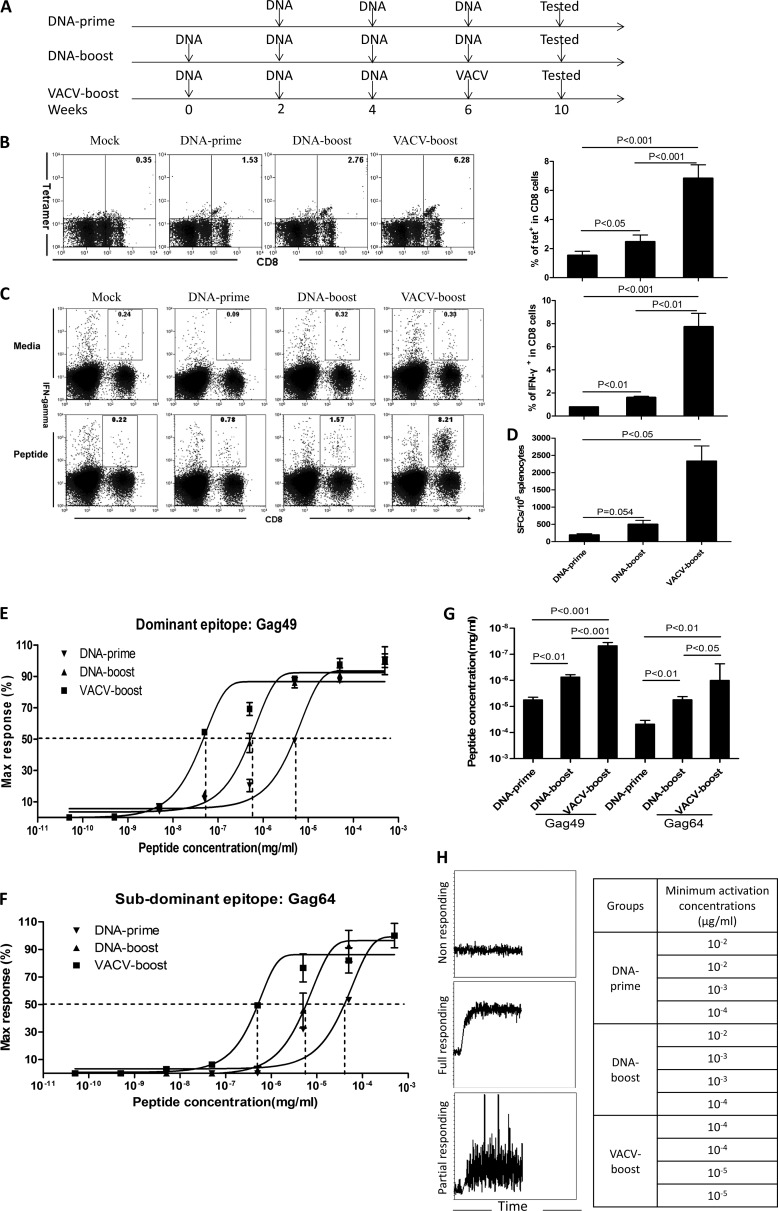
FIG 1.
VACV boosts CD8+ T-cell functional avidity by decreasing the CD8+ T-cell activation threshold. (A) Vaccination schedule. Three vaccination regimens were included in these studies. Vaccine was administered intramuscularly (i.m.) to BALB/c mice at weeks 0, 2, 4, and 6. All assays for characterization of T-cell immunity were carried out 4 weeks after the final inoculation. The vaccines express HIV-1 CN54-Gag. (B to D) Magnitude of Gag-specific CD8+ T-cell responses induced by different regimens. Representative flow-cytometric plots of tetramer (tet) staining (B) and intracellular staining (C) are shown on the left. Summary data are shown on the right. The ELISpot data are shown in panel D. SFCs were counted for 106 cells. (E to G) CD8+ T-cell functional avidity was enhanced by VACV boost. The functional avidity of a dominant epitope (E) and a subdominant epitope (F) are shown. The EC50 data are shown in panel G. (H) The T-cell activation threshold was determined as the sensitivity of CD8+ T cells to anti-CD3ζ antibody stimulation. The immediate responses after stimulation were monitored by Ca2+ influx in antigen-specific CD8+ T cells by flow cytometry for 5 min. Examples of flow-cytometric plots are on the left, and the concentrations of anti-CD3ζ antibodies for activation of Ca2+ influx in tetramer-positive CD8+ T cells from each mouse are displayed on the right. Data are representative of at least three independent experiments with at least 4 mice per group. Statistical analysis was performed by t test using SPSS16.0 software, and the P values of the comparisons between any two groups are labeled.

