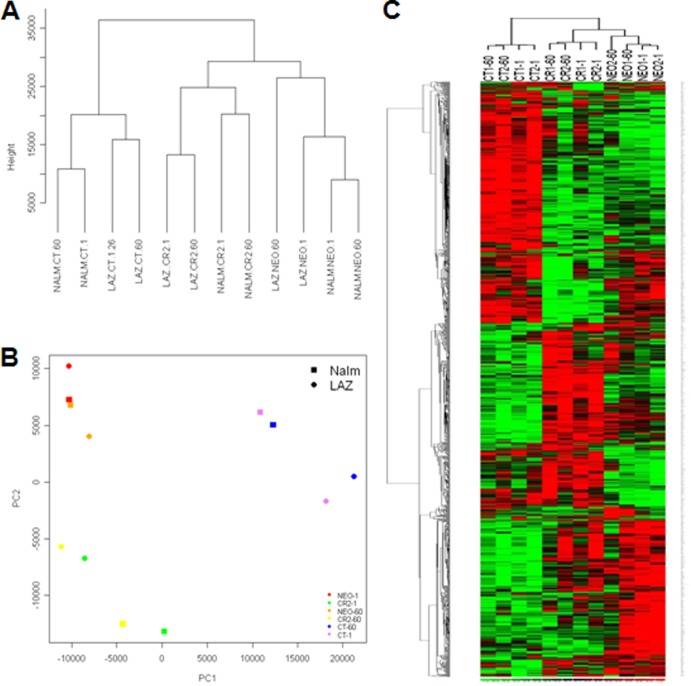
FIG 3.
Unsupervised clustering and principal-component analysis of the gene expression data. (A) An unsupervised Euclidean distance-based cluster of arrays after normalizing the data demonstrates that B-cell lines that express CT, CR, or NEO form separate clusters that correlate better with one another than with cells expressing an alternate receptor form. (B) PCA analysis demonstrates that CT, CR, and NEO cells have distinct gene expression patterns. (C) Heat map of the differentially expressed genes by comparing NEO, CT, and CR at 1 min and 60 min demonstrates that NEO, CR, and CT cells have a set of unique differentially expressed genes. Rows represent genes, and columns represent samples from CT, CR, and NEO groups. Genes are clustered using row-normalized signals and mapped to the [−1,1] interval (shown in scales beneath each heat map). Red and green represent high and low expression values, respectively.

