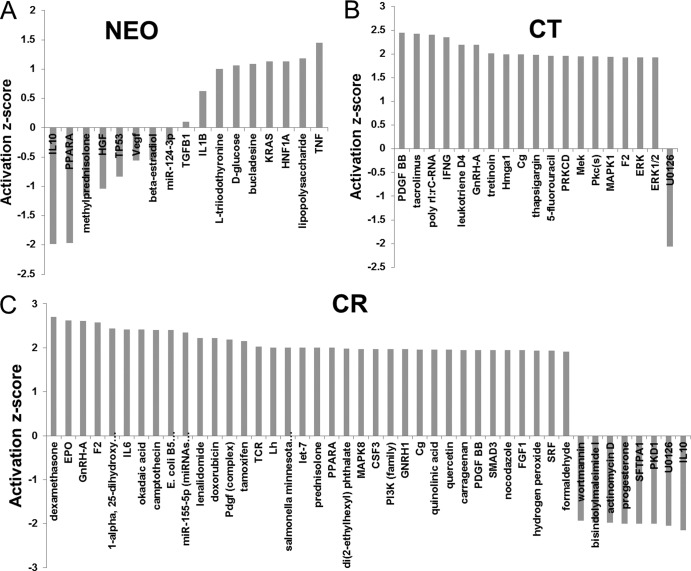
FIG 7.
Comparison of predicted upstream regulators of NEO, CT, and CR transcripts at 60 min after EBV infection. Differentially expressed genes were processed through Ingenuity Pathway Analysis to predict the downstream regulators whose activation status was affected following EBV interaction. No regulators reached the significant activation z score of −2 or +2 in NEO (A), whereas several regulators were predicted to be activated (z-score of >2) in CT (B) and a significantly larger number of regulators was either activated or inhibited (z score of <−2) in CR (C).

