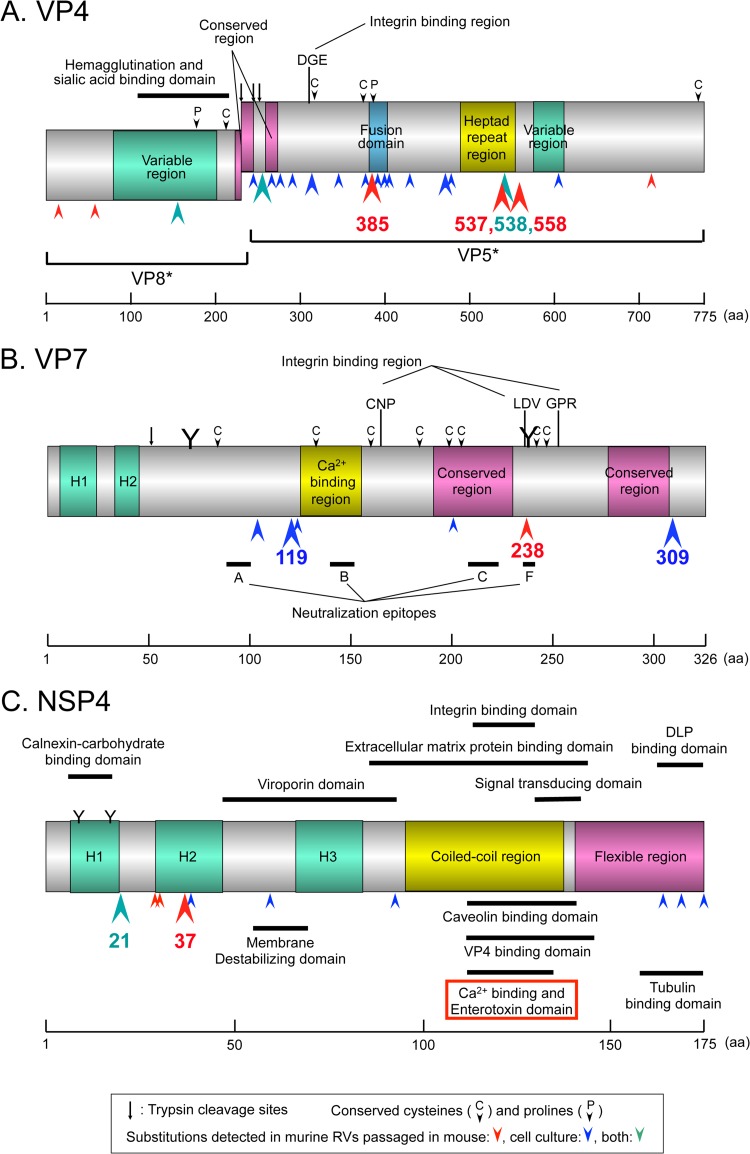
FIG 4.
Schematic diagram of substitutions detected on VP4 (A), VP7 (B), and NSP4 (C). Numbers indicate the amino acid position on each of three genes (1, 22, 34–36). Red, blue, and green arrowheads indicate substitutions detected in murine RVs passaged in mouse, cell culture, or both, respectively. Big, middle, and small arrowheads indicate substitutions occurring, respectively, in >5, in 3 to 4, or in 1 to 2 strains detected during serial passages in mice and/or in cell cultures. (A) Substitution at aa 538 detected in both passages in mice and passages in cell cultures (see Fig. 3J).

