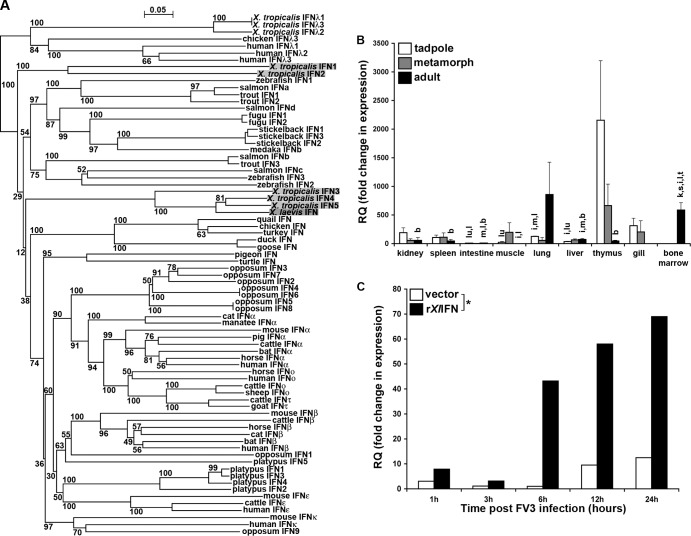
FIG 1.
Analysis of X. laevis IFN phylogeny (A), quantitative tissue gene expression (B), and capacity to elicit A6 kidney cell MX1 gene expression (C). (A) The phylogenetic tree was constructed from a multiple-sequence alignment using the neighbor-joining method and bootstrapped 10,000 times; the bootstrap values are expressed as percentages. (B) Tissues from outbred premetamorphic (stages 54 to 56) tadpoles and metamorphic (stage 64) and adult (2 years old) frogs were assessed. Tissues from 3 individuals of each stage were examined. The individual letters above the bars correspond to tissues exhibiting significantly different (P < 0.05) IFN gene expression: k, kidney; s, spleen; i, intestine; m, muscle; lu, lung; l, liver; t, thymus; g, gill; b, bone marrow. (C) A6 cells (1 × 10⁶) were incubated for the indicated times with 50 ng/ml rXlIFN or an equal volume of the vector control, harvested, and assessed by qRT-PCR for MX1 gene expression. *, statistically significant difference (P < 0.05) in variance between the vector- and rXlIFN-treated A6 cell cultures over time. The level of expression of both genes relative to that of the GAPDH endogenous control was examined (B and C). RQ, relative quantification values.

