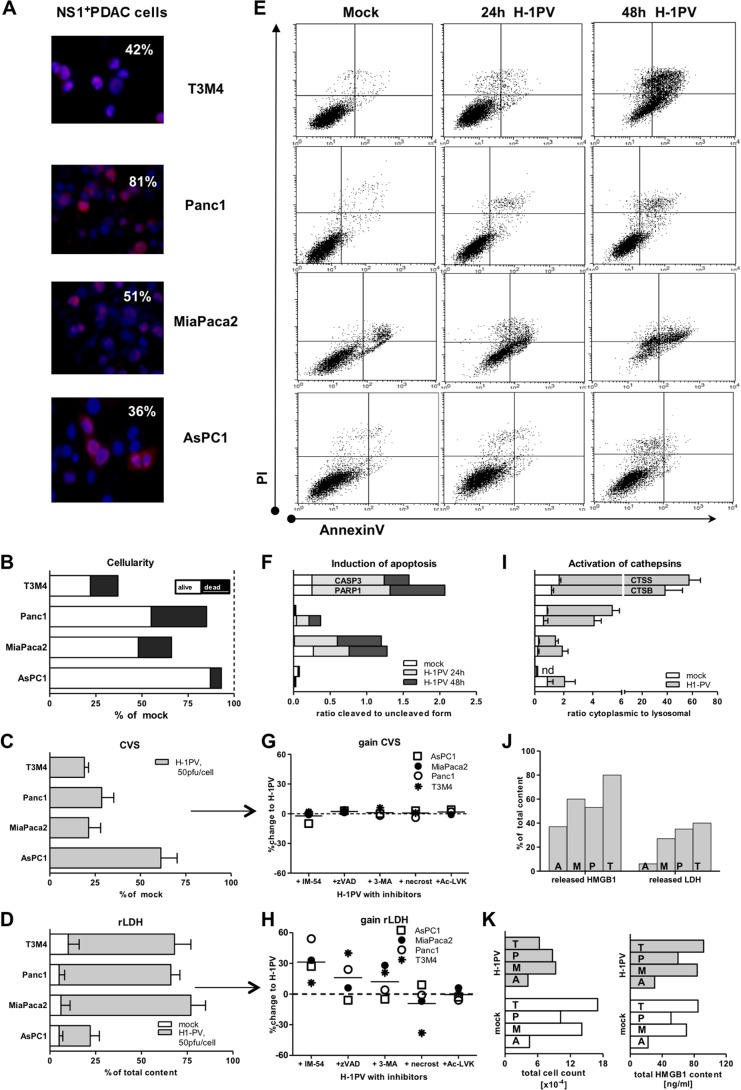
FIG 2.
H-1PV-induced PDAC cell death. (A) Infectivity of PDAC cells as determined by immunofluorescence using antibodies targeting the viral nonstructural protein NS1 upon exposure of PDAC cells to H-1PV at an MOI of 10 PFU/cell for 48 h (magnification, ×40). (B) Assessment of cytoreduction at an MOI of 10 PFU/cell by means of crystal violet staining of viable cells (CVS; % of mock) and colorimetric analysis of released LDH as a measure of death (oncolysis). The degree of lysis in the infected cultures was determined by calculating the ratio between released and total (whole Triton X-100-treated cultures) LDH content (rLDH). Subsequent combination of CVS (alive) and LDH (dead) levels allowed us to estimate the total cellularity of each infected culture in relation to the mock setups. (C and D) Cytoreduction (C) and lysis (D) at an MOI of 50 PFU/cell. (E) Compromised membrane integrity (apoptotic and necrotic events) as determined by means of annexin V- and PI-based flow cytometry. The dot blots depict profiles recorded at 24 h for mock infection and at 24 to 48 hpt for H-1PV infection at an MOI of 10 PFU/cell. (F) Molecular markers of apoptosis as assessed by Western blotting of whole-cell lysates, mock or H-1PV treated (10 PFU/cell), using PARP1 and CASP3 antibodies, with results normalized to β-actin levels upon densitometric analyses of images by use of ImageJ software. Data show the ratios between cleaved and uncleaved isoforms. (G and H) Infected PDAC cells (50 PFU/cell) were treated simultaneously with a panel of cell death pathway inhibitors: the oxidative stress inhibitor IM-54, the apoptosis inhibitor Z-VAD-FMK, the autophagy inhibitor 3-MA, the necroptosis inhibitor necrostatin-1, and the cathepsin B inhibitor Ac-LVK-CHO (see Table 1 for details). The data points indicate gain or loss of survival (CVS) and lysis (LDH) between noninhibited H-1PV-infected cultures (as in panels C and D) and inhibited cultures (mean change of value [%]). (I) PDAC cells were infected at an MOI of 10 PFU/cell. At 48 hpt, cells were harvested and samples were subjected to subcellular fractionation. The activities of CTSB and CTSS were determined for cytosolic and crude lysosomal fractions. The ratios between the cytosolic and crude lysosomal values were calculated for mock- and H-1PV-infected cells. nd, not determined. (J) Measurements of released HMGB1 and released LDH differently estimated the degree of oncolysis in infected cultures. (K) The correlation between cellularity and HMGB1 content was observed in mock- but not H-1PV-infected cultures. T, T3M4 cells; P, Panc1 cells; M, MiaPaca2 cells; A, AsPC1 cells.

