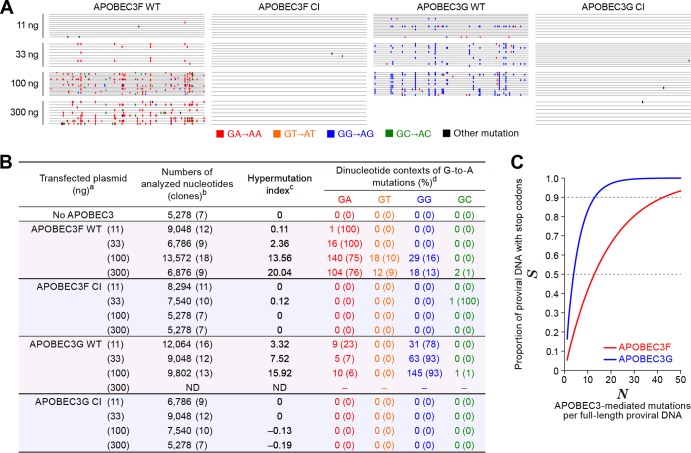
FIG 4.
Mutation signatures and in silico analysis. (A and B) Summary of viral DNA sequence analyzed in this study. (A) Raw sequence data (the sequences are available upon request). (B) Summarized table. a, The number in parenthesis represents the amount of transfected APOBEC3-expressing plasmid; b, the numbers of analyzed nucleotides and clones (in parenthesis) are shown; c, hypermutation index (38, 43) is calculated as follows: (no. of G-to-A mutations − no. of A-to-G mutations)/sequence length (bp) × 1,000; d, the number and the percentage (in parenthesis) of dinucleotide contexts of G-to-A mutation sites in total G-to-A mutations are shown. ND, not determined, probably due to a high level of G-to-A hypermutations mediated by APOBEC3G in the primer-binding region of template DNA that resulted in the failure of the PCR process under this condition (53, 54). (C) In silico analyses. The effects of G-to-A mutations mediated by APOBEC3F (GA to AA, red line) or APOBEC3G (GG to AG, blue line) on the proportion of proviral DNA with stop codons (S, y axis) were estimated with equation 9 as described in the text.

