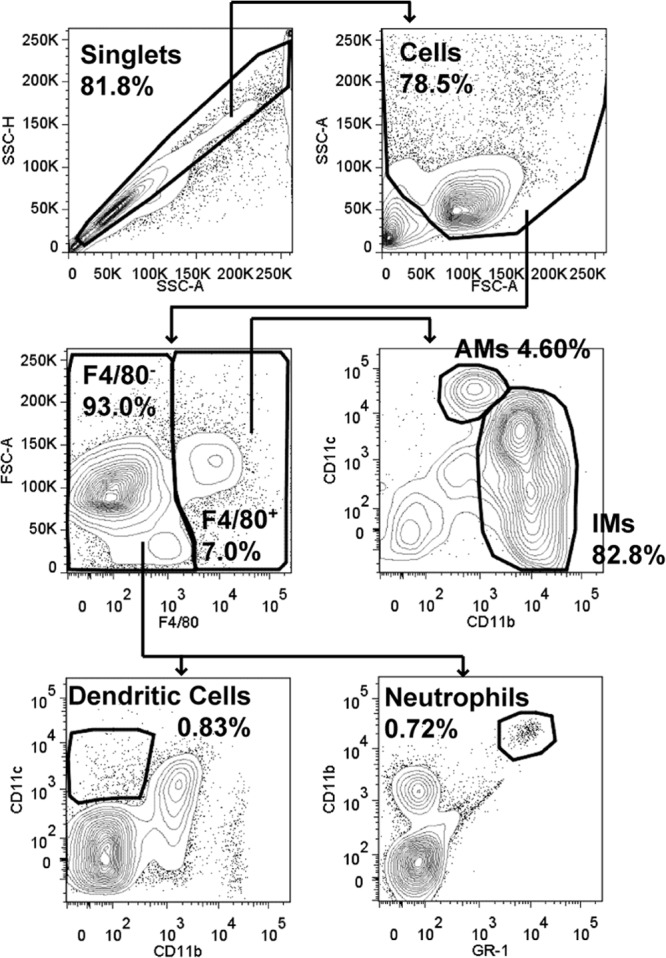
FIG 1.

Lung gating scheme. Single cells were discriminated from doublets by plotting side scatter height (SSC-H) versus side scatter area (SSC-A). Cells were selected by plotting SSC-A versus forward scatter area (FSC-A). F4/80− and F4/80+ cells were gated on by plotting FSC-A versus F4/80. From the F4/80+ gate, alveolar macrophages (AMs) were discriminated from interstitial macrophages (IMs) by plotting CD11c versus CD11b. Of the F4/80− cells, dendritic cells were identified by plotting CD11c versus CD11b and neutrophils were identified by plotting CD11b versus GR-1. For each gate, the percentage of the parent gate is indicated in bold (for example, AMs are 4.6% of the cells within the F4/80+ gate).
