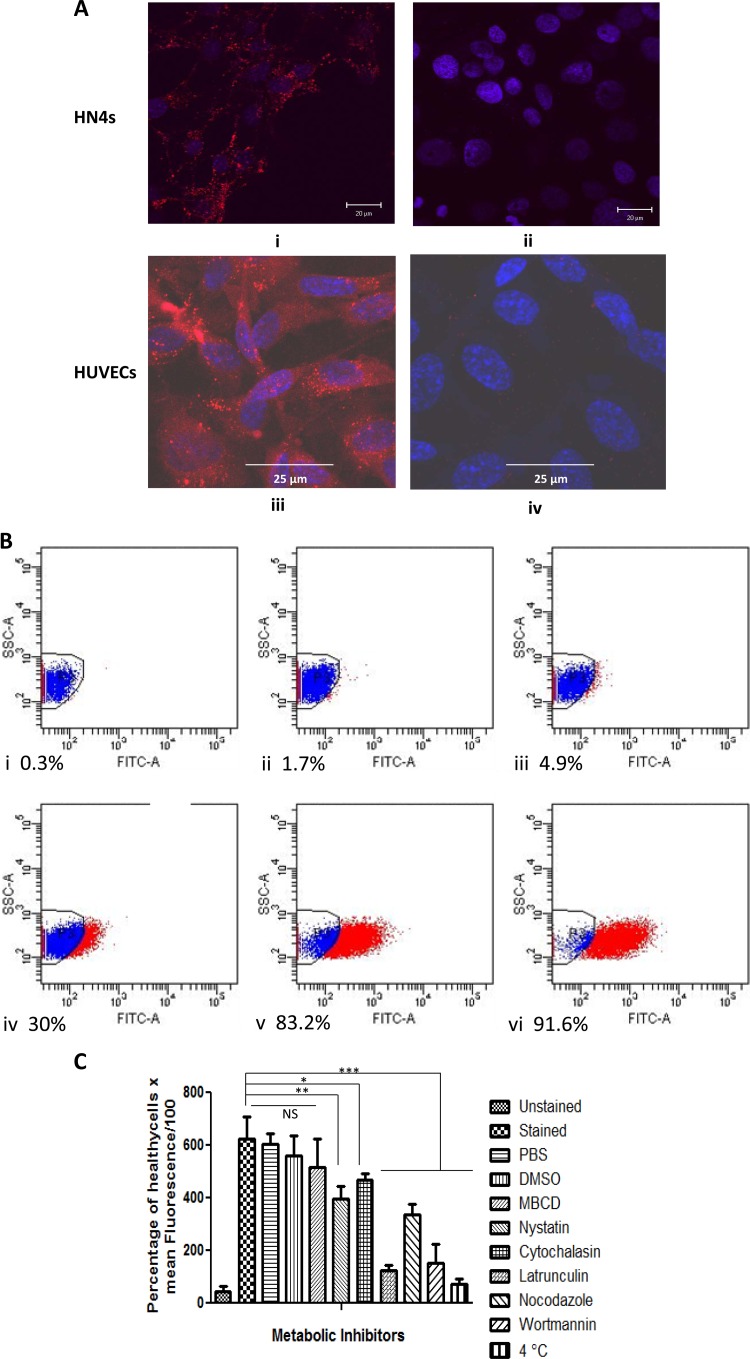
FIG 4.
Internalization of AdpF by eukaryotic cells. (A) Internalization of rAdpF by various eukaryotic cells. Cy5-labeled rAdpF proteins were incubated with eukaryotic cells as described in the text, and the cells were examined using confocal microscopy. A 100× oil immersion objective lens was used to collect images in the x, y, and z planes. Ratiometric confocal image slices of HN4 cells treated with labeled rAdpF were taken at 0.32-μm intervals. rAdpF (i and iii) and BSA as a control (ii and iv) on HN4 cells and HUVECs were used for this study. The image shows the presence of labeled rAdpF proteins as red spots, and the nuclei of the eukaryotic cells are visualized in blue (stained with DAPI). The images of a cell section at 1 μm below the cell surface are shown. (B) Flow cytometry analysis of time-dependent internalization of fluorescein-labeled AdpF in HN4 cells at 0 min (i), 2 min (ii), 5 min (iii), 12 min (iv), 30 min (v), and 60 min (vi) postexposure. The percentage of cells which were positive and entered the next gate is indicated for each time point. (C) Effects of various inhibitors on internalization of AdpF by HUVEC cells. HUVECs were preincubated with various inhibitors as described in Materials and Methods and were exposed to labeled rAdpF. The ability of rAdpF to be internalized by the host cells was determined by flow cytometry. The inhibitor concentrations resulted in 90% of the cells remaining viable. The relation used in the plot is as follows: (percentage of healthy cells × mean fluorescence)/100. Error bars are described in Materials and Methods. *, P < 0.05; **, P < 0.01; ***, P < 0.0001; NS, not significant.

