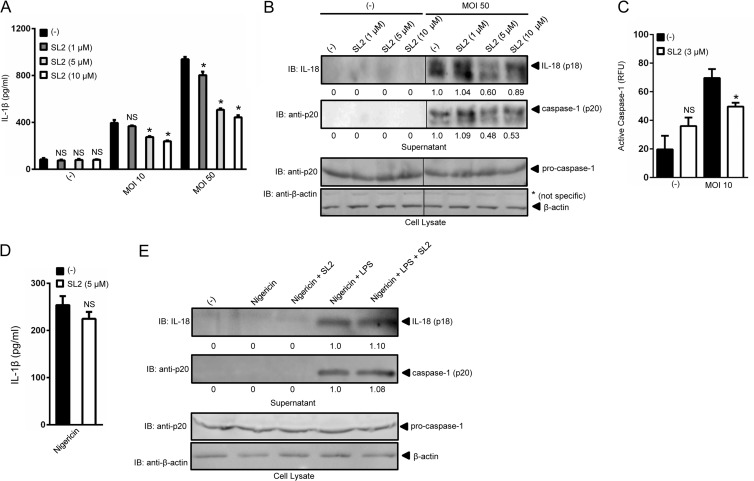
FIG 2.
Sialostatin L2 inhibits A. phagocytophilum-induced caspase-1-mediated cytokine secretion. (A) BMDMs (5 × 10⁵) were stimulated with A. phagocytophilum (MOIs of 10 and 50) in the presence or absence of sialostatin L2 (SL2) for 18 h at the indicated concentrations. IL-1β was measured by ELISA. One-way ANOVA with the Tukey test was used to compare nontreated and SL2-treated cells. *, P < 0.05; NS, not significant. (B) IL-18 (p18) and mature caspase-1 (p20) in supernatants were measured by Western blotting (IB). β-Actin and pro-caspase-1 were used as loading controls. (C) BMDMs (2 × 10⁵) were stimulated with A. phagocytophilum (MOI = 10) for 18 h in the presence or absence of SL2 (3 μM). The fluorescence inhibitor probe FAM-YVAD-FMK was used to label active caspase-1 in macrophages. The signal is shown as a function of relative fluorescence units (RFU). (D and E) BMDMs (5 × 10⁵) were stimulated with LPS (100 ng/ml) plus nigericin (10 μM) in the presence or absence of SL2 (5 μM). (D) IL-1β was measured by ELISA. Unpaired Student's t test was used to compare nontreated and SL2-treated cells. (E) IL-18 (p18) and mature caspase-1 (p20) in supernatants were measured by Western blotting (IB). β-Actin and pro-caspase-1 were used as loading controls. (−), nonstimulated cells. Numbers below the Western blot panels show quantitation by densitometry and indicate fold differences compared to non-SL2-treated samples.

