FIG 6.
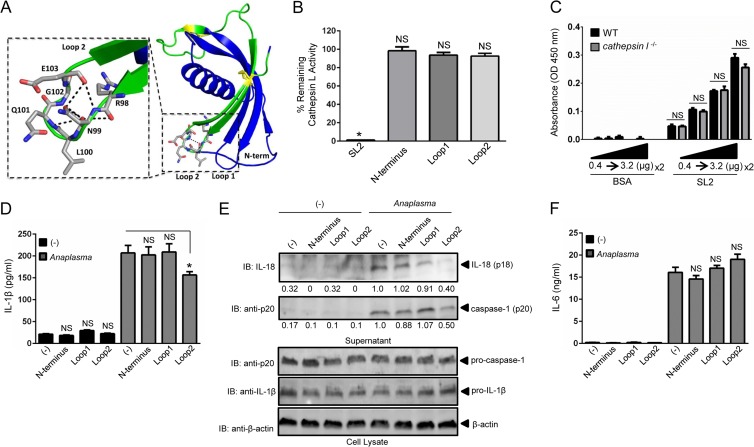
Loop2 of sialostatin L2 inhibits caspase-1-induced cytokine secretion during A. phagocytophilum stimulation of macrophages. (A) Sialostatin L2 (SL2) structure (PDB entry 3LH4) depicting the N terminus, Loop1, and Loop2. The synthesized Loop2 peptide is highlighted in green, with the yellow ball-and-stick format representing conserved disulfide bonds. (Inset) Loop2 residues RNLQGE are depicted in gray, with neighboring polar contacts shown as black dashed lines. (B) Inhibition assay showing the percentage of remaining cathepsin L activity in the presence or absence of SL2 or the N-terminal, Loop1, or Loop2 peptide (6 μM). Cathepsin L was used at 100 pM. Comparisons were done with the enzymatic activity in the absence of polypeptides, which was considered 100%. (C) BMDMs (5 × 10⁶) from wild-type (WT) and cathepsin l−/− mice were obtained, and 0.5 μg of cell lysate was used for SL2 binding at the indicated concentrations (0.4 to 3.2 μg). Polyclonal SL2 antibody (1:200 dilution) was used. (D and F) BMDMs (1 × 10⁶) were stimulated with A. phagocytophilum (MOI = 5) for 18 h in the presence or absence of the peptides representing the N terminus, Loop1, or Loop2. Peptides (5 μM) were added 30 min prior to A. phagocytophilum stimulation. IL-1β (D) and IL-6 (F) were measured by ELISA. (E) IL-18 (p18) and mature caspase-1 (p20) in supernatants were measured by Western blotting (IB). β-Actin, pro-IL-1β, and pro-caspase-1 were detected in the cell lysate at an MOI of 50. Experiments for panels B and C were repeated twice, while those for panels D to F were repeated seven times. Data are shown in triplicate and presented as means ± SEM. *, P < 0.05. For panels B, D, and F, one-way ANOVA with the Bonferroni test was used to compare nontreated and peptide-treated cells. For panel C, Student's t test was used to compare WT and cathepsin l−/− cells. (−), nonstimulated cells; NS, not significant. Numbers below the Western blot panels show quantitation by densitometry and indicate fold differences compared to non-peptide-treated samples.

