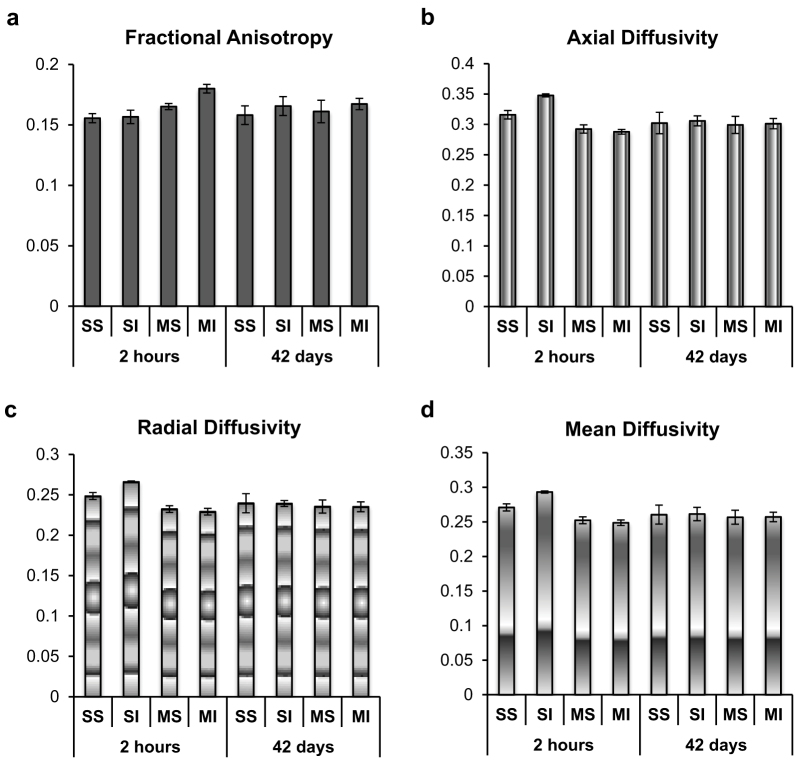
Figure 4. Mean DTI values at the two time points.
Data were extracted from each subject as a single value from the ROIs showing significance in the anatomical ROI analysis. Data are presented as the mean ± SEM for each experimental group (SS, single sham; SI, single-injured; MS, multiple sham; MI, multiple-injured).

