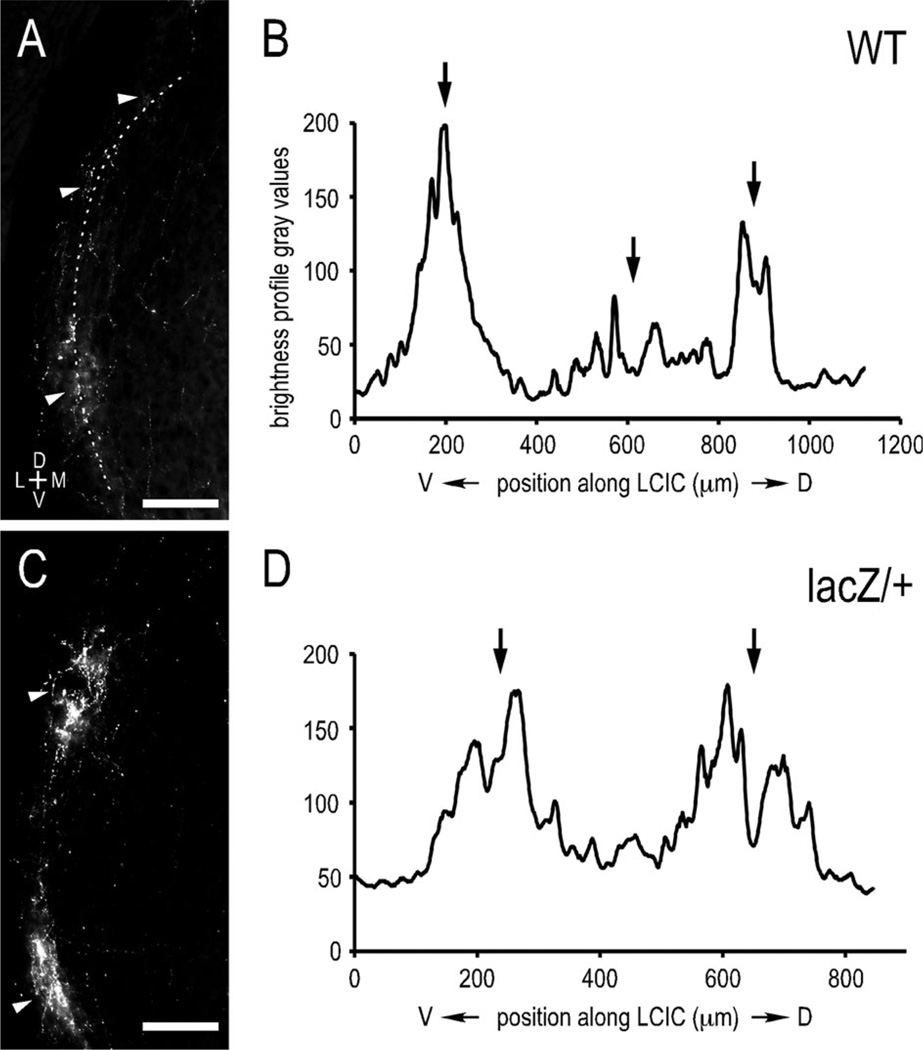
Figure 8.
Brightness profiles and autocorrelation functions of uncrossed LSO inputs in WT and ephrin-B2lacZ/+ mutants at P12. Curved contour sampling (dashed) of LSO axonal labeling in LCIC (A: WT; C: ephrin-B2lacZ/+) and corresponding brightness profiles (B,D; autocorrelation maxima = 0.774, 0.957, respectively). Modular axonal labeling (arrowheads, A,C) corresponds to peaks on matching brightness profiles (arrows, B,D). Strong autocorrelation maxima confirm modular compartmentalized LSO inputs to the LCIC in both WT and ephrin-B2lacZ/+ mutants, with no statistically significant difference between groups (Student’s t-test, P > 0.05). Scale bars = 200 µm.

