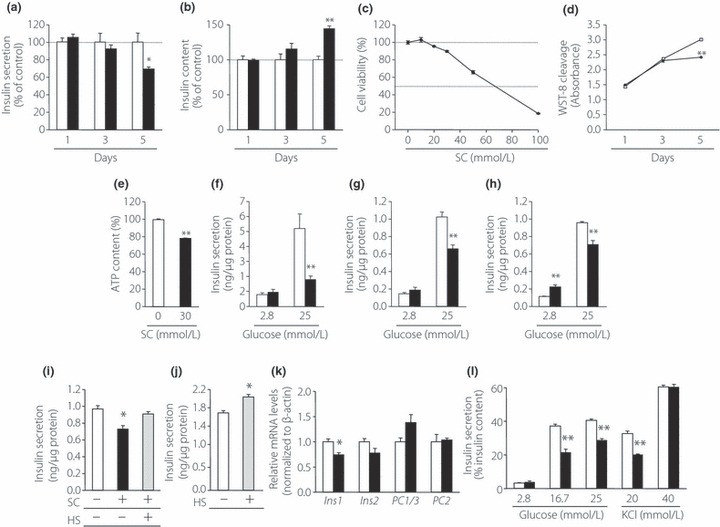
Figure 2.

Inhibitory effects of sodium chlorate (SC) treatment on insulin secretion. (a) Insulin secretion of MIN6T3 cells after treatment of SC. (b) Effect of SC treatment on the insulin content of MIN6T3 cells (n = 4). (c) Cell viability of MIN6T3 cells treated with various concentration of SC for 5 days. Viability of cells without SC treatment was indicated as 100% (n = 5–8). (d) Effect of SC treatment on cell proliferation. MIN6T3 cells were incubated with or without 30 mmol/L SC, and 2‐(2‐methoxy‐4‐nitrophenyl)‐3‐(4‐nitrophenyl)‐5‐(2,4‐disulfophenyl)‐2H‐tetrazolium, monosodium salt (WST‐8) cleavage was measured (n = 5–10). (e) Effect of SC treatment on the adenosine triphosphate (ATP) content in MIN6T3 cells (n = 9). Insulin secretion from (f) isolated islets, (g) MIN6 cells (h) and MIN6T3 cells was measured after incubation for 5 days with or without 30 mmol/L SC (n = 3–5). (i) Recovery of insulin secretion from SC‐treated cells after the addition of heparan sulfate (HS). MIN6T3 cells were treated with SC for 5 days in the presence or absence of 100 μg/mL HS, as indicated. Insulin secretion was measured using 25 mmol/L glucose (n = 3). (j) Enhancement of insulin secretion by supplement of HS. MIN6T3 cells were cultured with or without 100 μg/mL HS for 5 days (n = 3). (k) The messenger ribonucleic acid (mRNA) levels of insulin‐related genes were determined using real‐time reverse transcription polymerase chain reaction after incubation for 5 days with SC treatment. The mRNA level of each gene was expressed relative to that in cells that were incubated without SC treatment, which was set at 1 (n = 3). (l) Effect of SC treatment on insulin secretion from MIN6T3 cells in response to glucose or KCl. Data are expressed as insulin secretion relative to basal secretion at 2.8 mmol/L glucose (which was arbitrarily set at 1; n = 3–4). Open bars or squares, non‐treated cells; filled bars or squares, SC‐treated cells; shaded bars, HS‐treated cells. *P < 0.05; **P < 0.01.
