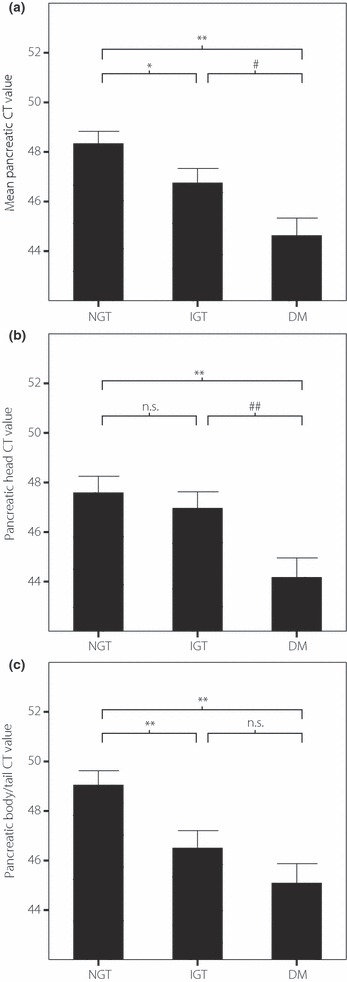
Figure 1.

Pancreatic head, body/tail and mean computed tomography (CT) values of normal glucose tolerance (NGT), impaired glucose tolerance (IGT) and diabetes mellitus (DM) are shown (*P < 0.05 vs NGT, **P < 0.01 vs NGT, #P < 0.05 vs IGT, ##P < 0.01 vs IGT). Pancreatic head and body/tail CT value are decreased from NGT through IGT to DM. In addition, mean pancreatic CT value is decreased significantly from NGT through IGT to DM (DM vs NGT P < 0.01, DM vs IGT P < 0.05, IGT vs NGT P < 0.05).
