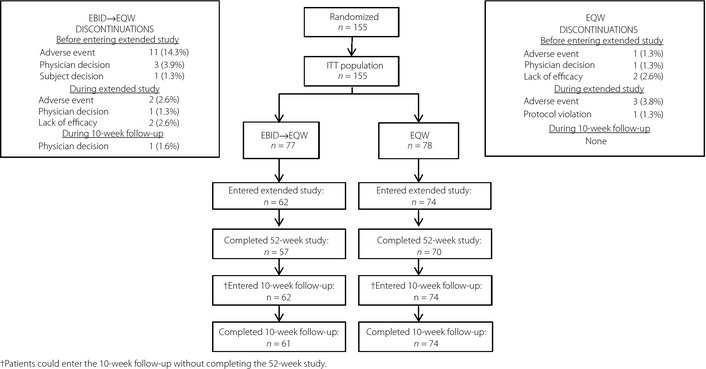
Figure 1.

Patient flow diagram. Data shown for discontinuations are presented as n (%). EBID, 10 mcg exenatide b.i.d.; EBID→EQW, patients assigned to 10 mcg exenatide b.i.d. during the initial 26‐week study who were switched to 2 mg exenatide once weekly for the extended 26 weeks; EQW, 2 mg exenatide once weekly; ITT, intent‐to‐treat.
