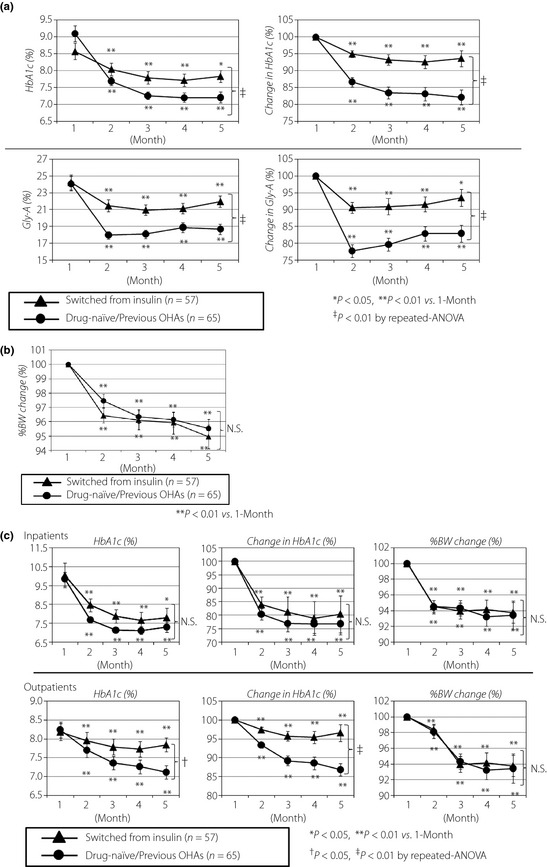
Figure 2.

(a) The improvement in glycated hemoglobin (HbA1c) levels in the group of drug‐naïve/previous oral hypoglycemic agents (OHAs; round) and in the group that switched from insulin (triangle) in the 4‐month observation period (upper panel). The improvement in glycosylated albumin (Gly‐A) levels in the group of drug‐naïve/previous OHAs (round) and in the group that switched from insulin (triangle) in the 4‐month observation period (lower panel). (b) The improvement in percent bodyweight in the group of drug‐naïve/previous OHAs (round) and in the group that switched from insulin (triangle) in the 4‐month observation period. (c) The improvement in HbA1c levels and percent bodyweight in the group of drug‐naïve/previous OHAs (round) and in the group that switched from insulin (triangle) in the 4‐month observation period in hospitalized patients (upper panel). The improvement in HbA1c levels and percent bodyweight in the group of drug‐naïve/previous OHAs (round) and in the group that switched from insulin (triangle) in the 4‐month observation period in outpatients (lower panel). The comparison was carried out by paired two‐tailed Student's t‐test and repeated anova tests. All values are expressed as mean ± SEM. BW, bodyweight; N.S., not significant.
