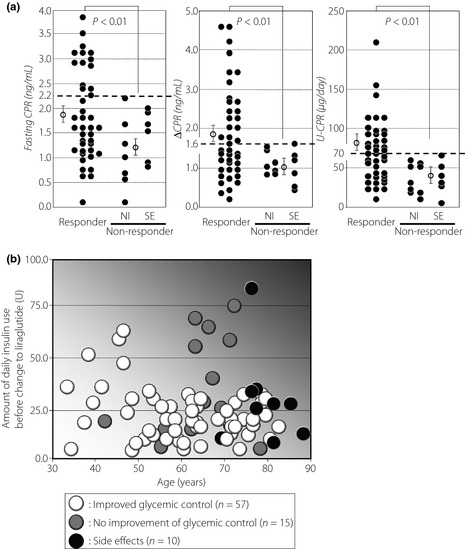
Figure 3.

(a) Comparisons of fasting C‐peptide immunoreactivity (CPR; left panel), delta CPR before and after breakfast (middle panel), and urine CPR (right panel) levels between responders and non‐responders. The comparison was carried out by unpaired two‐tailed Student's t‐test. Bars indicate mean ± standard error of the mean. NI, no improvement for glycemic control; SE, side‐effects. (b) Investigation and comparison of background factors between responders (white circles) and non‐responders (gray circles, no improvement of glycemic conrol; black circles, side‐effects) after switching to liraglutide from insulin. The vertical axis represents the amount of daily insulin use before switching to liraglutide, and the horizontal axis represents the age.
