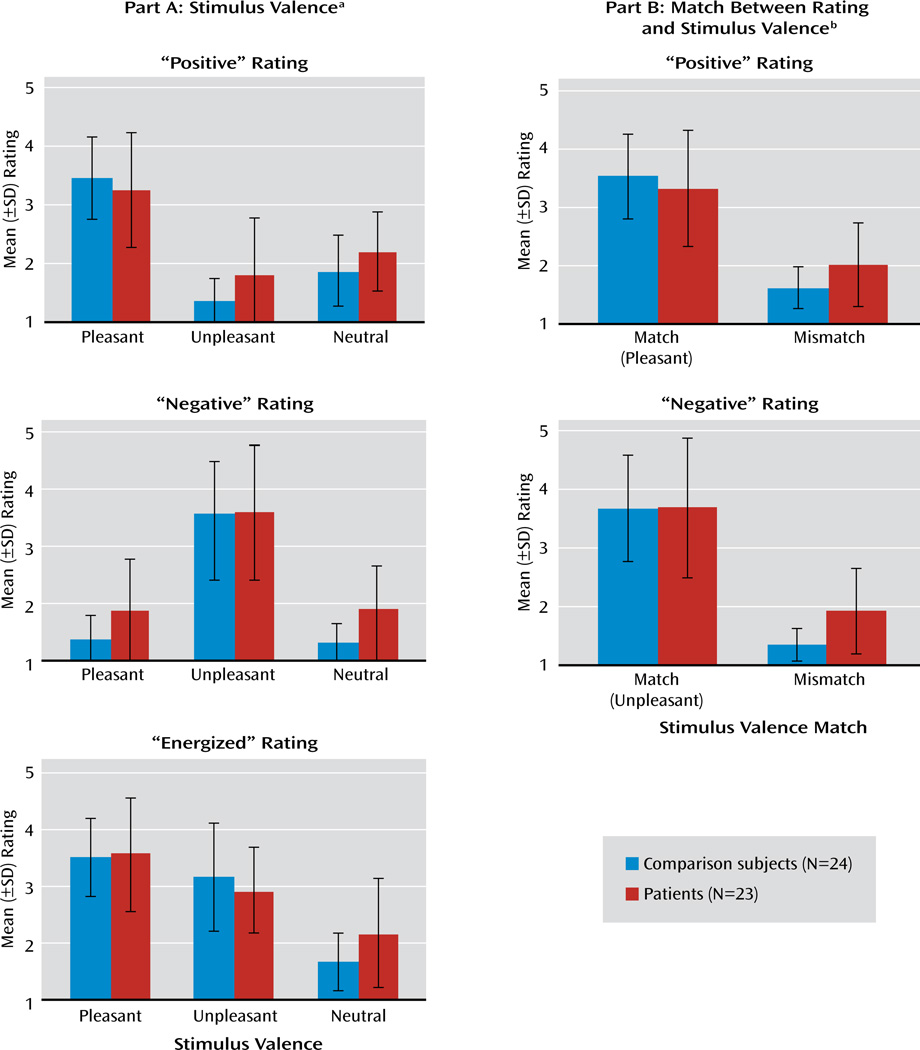
FIGURE 2. Delayed Experience Ratings by Patients With Schizophrenia and Healthy Comparison Subjects After Viewing Pictures With Varying Emotional Valence.
a Data are displayed according to the type of rating (how “positive,” “negative,” or “energized” the subject felt while viewing the preceding picture) and valence of the stimulus (pleasant, unpleasant, or neutral picture). The difference in mean ratings across stimulus valence illustrates higher “positive” ratings for pleasant stimuli than for unpleasant or neutral ones, higher “negative” ratings for unpleasant stimuli than for pleasant or neutral ones, and higher “energized” ratings for pleasant and unpleasant stimuli than for neutral ones. The main effect of stimulus valence was significant in the “positive” ratings (F=83.03, df=2, 44, p<0.001), “negative” ratings (F=83.03, df=2, 44, p<0.001), and “energized” ratings (F=78.92, df=2, 44, p<0.001). The group-by-valence interactions were significant for the “positive” ratings (F=3.28, df=2, 44, p=0.05) and “energized” ratings (F=3.88, df=2, 44, p=0.03) but not for the “negative” ratings (F=2.02, df=2, 44, p=0.14).
b Data for “positive” and “negative” ratings are displayed according to the degree of match between the type of rating and stimulus valence. For “positive” ratings, pleasant pictures were considered matching stimuli while unpleasant or neutral ones were mismatches; for “negative” ratings, unpleasant pictures were matching stimuli, while pleasant or neutral ones were mismatches. Group differences were reflected in significant group-by-match interactions for “positive” ratings (F=5.20, df=1, 45, p=0.03) and “negative” ratings (F=3.88, df=1, 45, p=0.05). Analyses of simple main effects confirmed that these interactions were driven by differences between the patients and comparison subjects in the ratings when the stimulus valence was a mismatch relative to the type of experience being rated (p=0.02 and p=0.001 for “positive” and “negative” ratings, respectively) but not when the stimulus valence matched the rating (p>0.39 in both cases).

