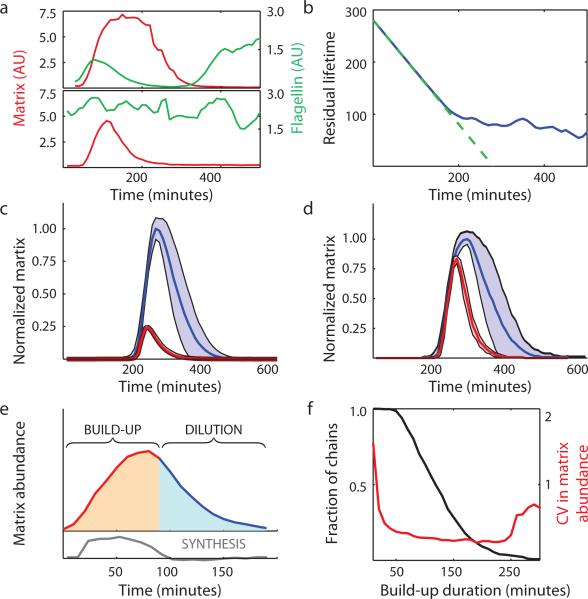
Figure 4. Slr executes a stereotyped chaining program.
a, Example matrix and flagellin traces from strains where chaining (top panel, TMN1195 = Phag-mKate2 PtapA-cfp hagA233V Pspank-sinI) or pulsing (bottom panel, TMN1196, which is TMN1195 mutated for slr) were inducible by addition of IPTG. b, Aging curve for induced chains is shown (177 events). Green dashed curve shows expectation for a timer. c, Average matrix expression profiles for chains arising spontaneously (blue curve, TMN1157, 198 events) and pulses arising spontaneously in slr mutant cells (red curve, TMN1158, 278 events). Shaded regions denote ± 1 standard deviation. Average profiles are scaled to reflect the average height difference between chains and pulses. d, The same analysis for chains (blue curve, TMN1195, 26 events) and pulses (red curve, TMN1196, 42 events) induced by addition of IPTG. e, Matrix expression during chaining naturally breaks down into a build-up phase (red curve), where synthesis of new proteins dominates, and a subsequent dilution phase (blue curve). Grey curve shows the calculated synthesis rate (SI) used to call the two phases. f, Long build-up phases reduce noise in matrix expression by time averaging. The plot shows the fraction of chains achieving a build-up phase of a given duration (black curve) and the variability in matrix expression of those chains (red curve). Similar results have been obtained in three replicate experiments.

