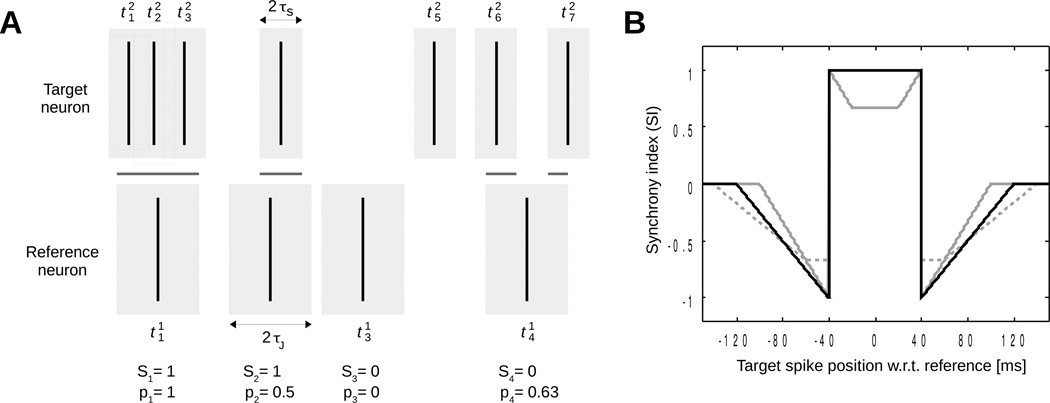
Figure 1.
Coincidence detection and synchrony index. (A) Two spike trains (target neuron and reference neuron . Gray rectangles around spikes of the target neuron represent windows for detecting coincidences (Si = 1) and those around spikes of the reference neuron represent jitter windows. The intersection between these two sets of windows (shown as horizontal gray lines) is associated with the pi values. Values of Si and pi are given below each spike of the reference neuron assuming πJ/τs = 2. (B) Synchrony index of two spikes as a function of the time interval between them (τs = 40 ms). Solid black line: πJ/τs = 2; solid gray line: πJ/τs = 1.5; dashed gray line: πJ/τs = 2.5.

