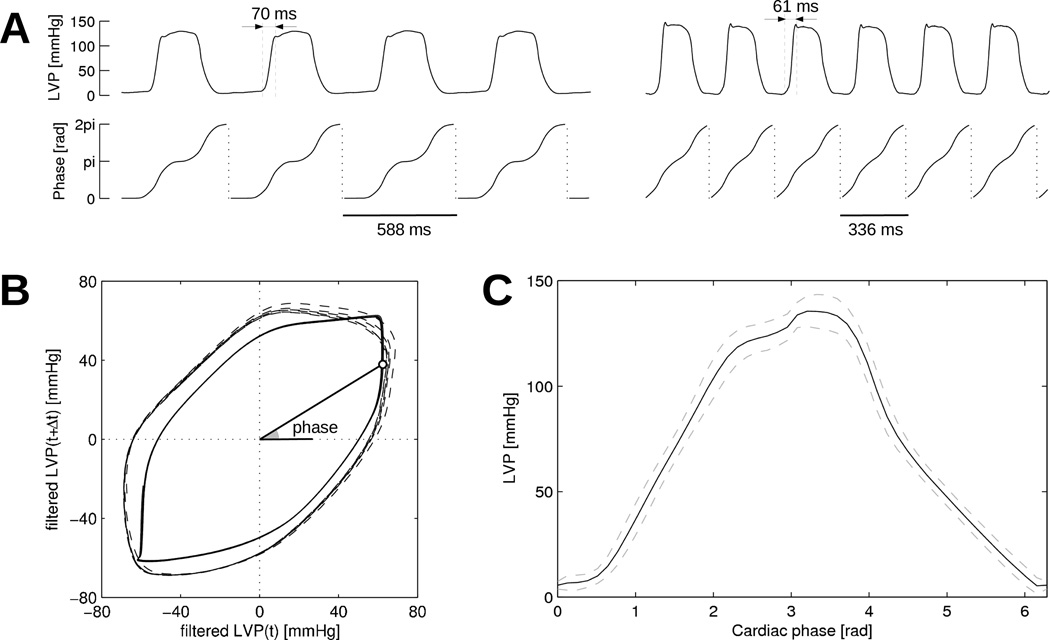
Figure 3.
Determination of cardiac phase from left ventricular pressure (LVP). (A) LVP signal and corresponding cardiac phase in two time segments with slow (signals on the left) and fast (signals on the right) heart rates in the same dog. (B) Reconstruction of the cardiac phase. Solid line: slow heart rate signal from panel A; dashed line: fast heart rate. (C) Mean (solid line) and standard deviation (dashed lines) of LVP profile as a function of phase. Statistics are computed over the whole LVP signal.

