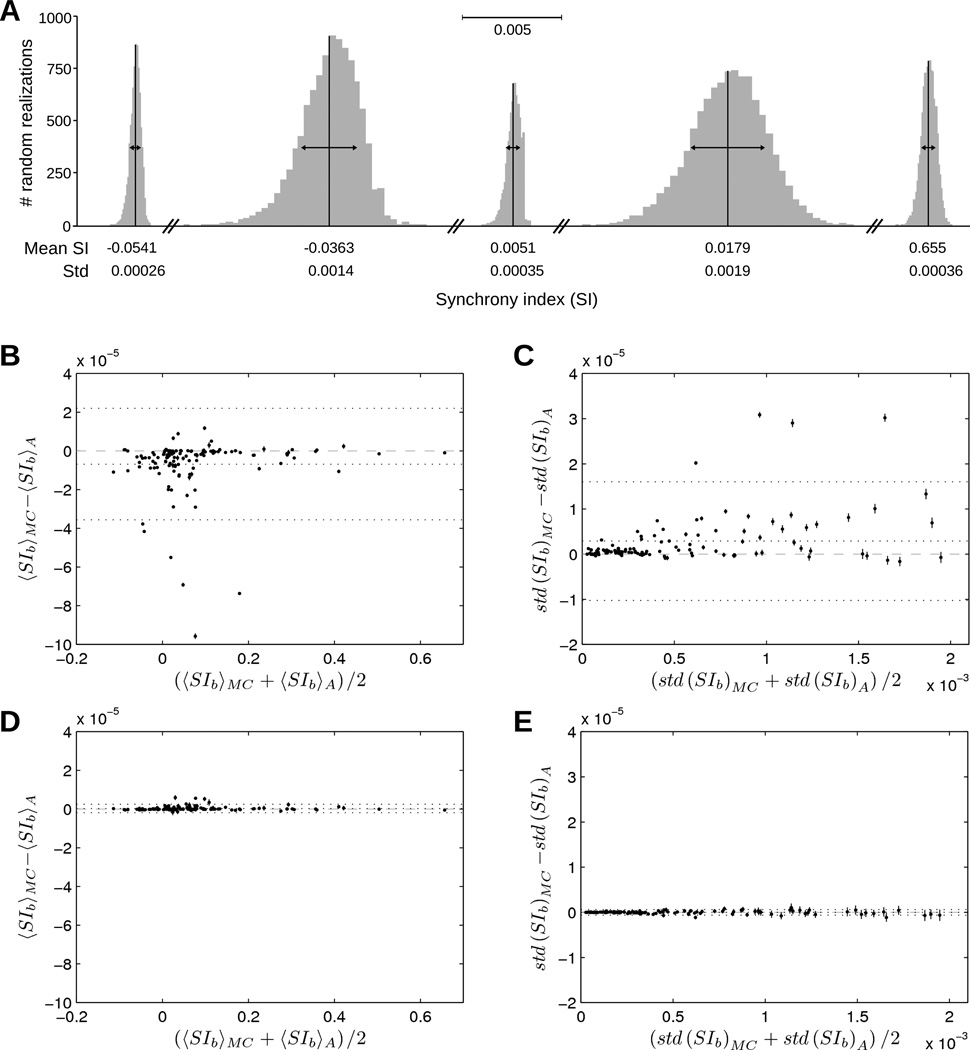
Figure 6.
Estimating the effect of blanked intervals on SI. (A) Distribution of SIb values obtained after 10,000 realizations of random insertions of spikes within the blanked intervals. Mean and standard deviation (std) of SIb are indicated below each distribution. (B) Bland-Altman plot showing the difference in mean(SIb) between the Monte-Carlo (MC) formula (12) computed using 150 runs of 10,000 realizations and the analytical (A) formula (14). The mean over these 150 runs (dots) and their standard error of the mean (error bar) are shown. Horizontal dotted lines indicate the mean bias and 95% confidence interval. (C) Same Bland-Altman plot as panel B for the standard deviation of SIb. (D)–(E) Same plots as panels B–C after blanked intervals too close to each other (ak+1 − bk < 2τs + 2τJ) have been discarded.

