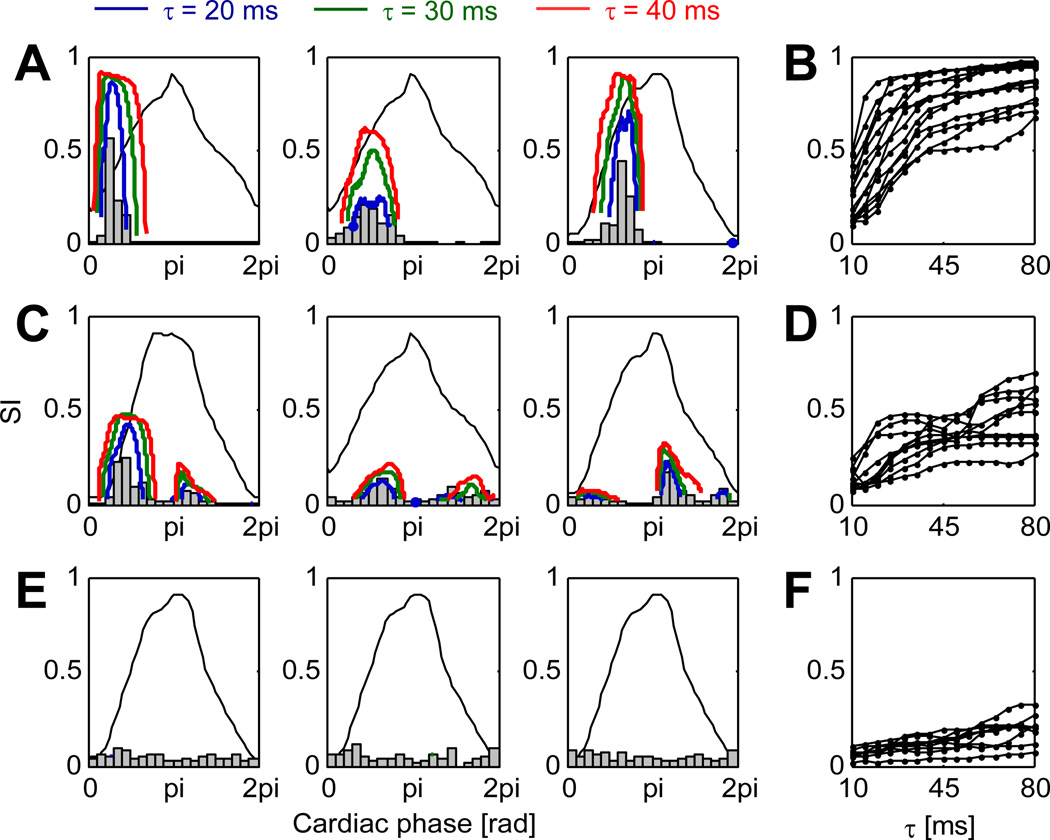
Figure 8.
Synchrony with cardiovascular inputs. (A) Histogram of , i.e. the cardiac phase at the time of each spike, for three cardiovascular-related neurons firing during one specific phase of the cardiac cycle. Thick solid lines show the synchrony index (for three values of τs = 20, 30 and 40 ms) as a function of cardiac phase. Non-significant data points (p > 0.01) are discarded. The thin solid line represents the profile of left ventricular pressure as a function of cardiac phase. (B) Peak value of the synchrony index (SI) with respect to cardiac phase as a function of τs for a set of neurons of the type shown in panel A. (C) Same as panel A for cardiovascular-related neurons firing at more than one phase of the cardiac cycle. (D) Same as panel B for neurons of the type of panel C. (E) Same as panel A for non-cardiovascular-related neurons. (F) Same as panel B for neurons of the type of panel E.

