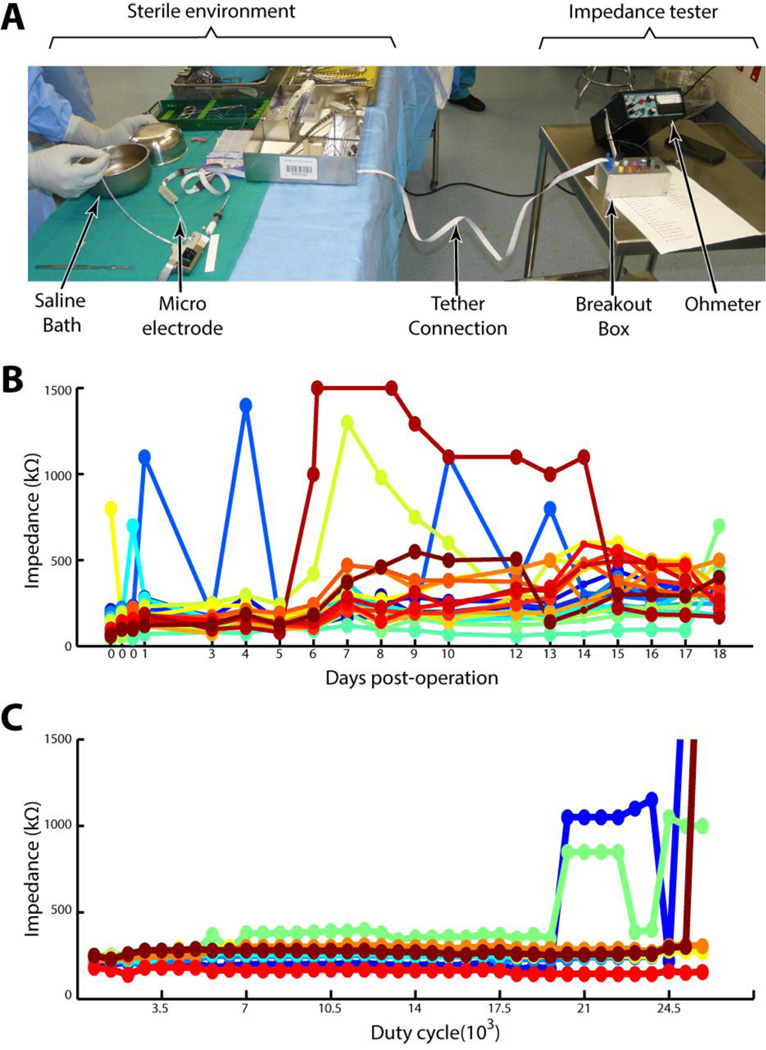
Figure 3. Impedance measurement.
A: The set-up to measure impedances in the surgical environment. The left half of the figure represents the sterile field, the right half the non-sterile area where impedances were obtained by the research assistant. B: Impedances taken every day during one patient’s hospital course. Each color represents a different micro-electrode. C: Impedances taken for 8 micro-electrodes using the fatigue bench-top simulation.

